Powering mission-critical nature-society
Where your data meets purpose — eOceans® is the end-to-end platform for data science, results, and communications, enabling timely, credible, and meaningful results everywhere on our blue planet.

Built for speed. Built for trust. Built for impact. Proudly Canadian.
Concept to completion — all on eOceans®
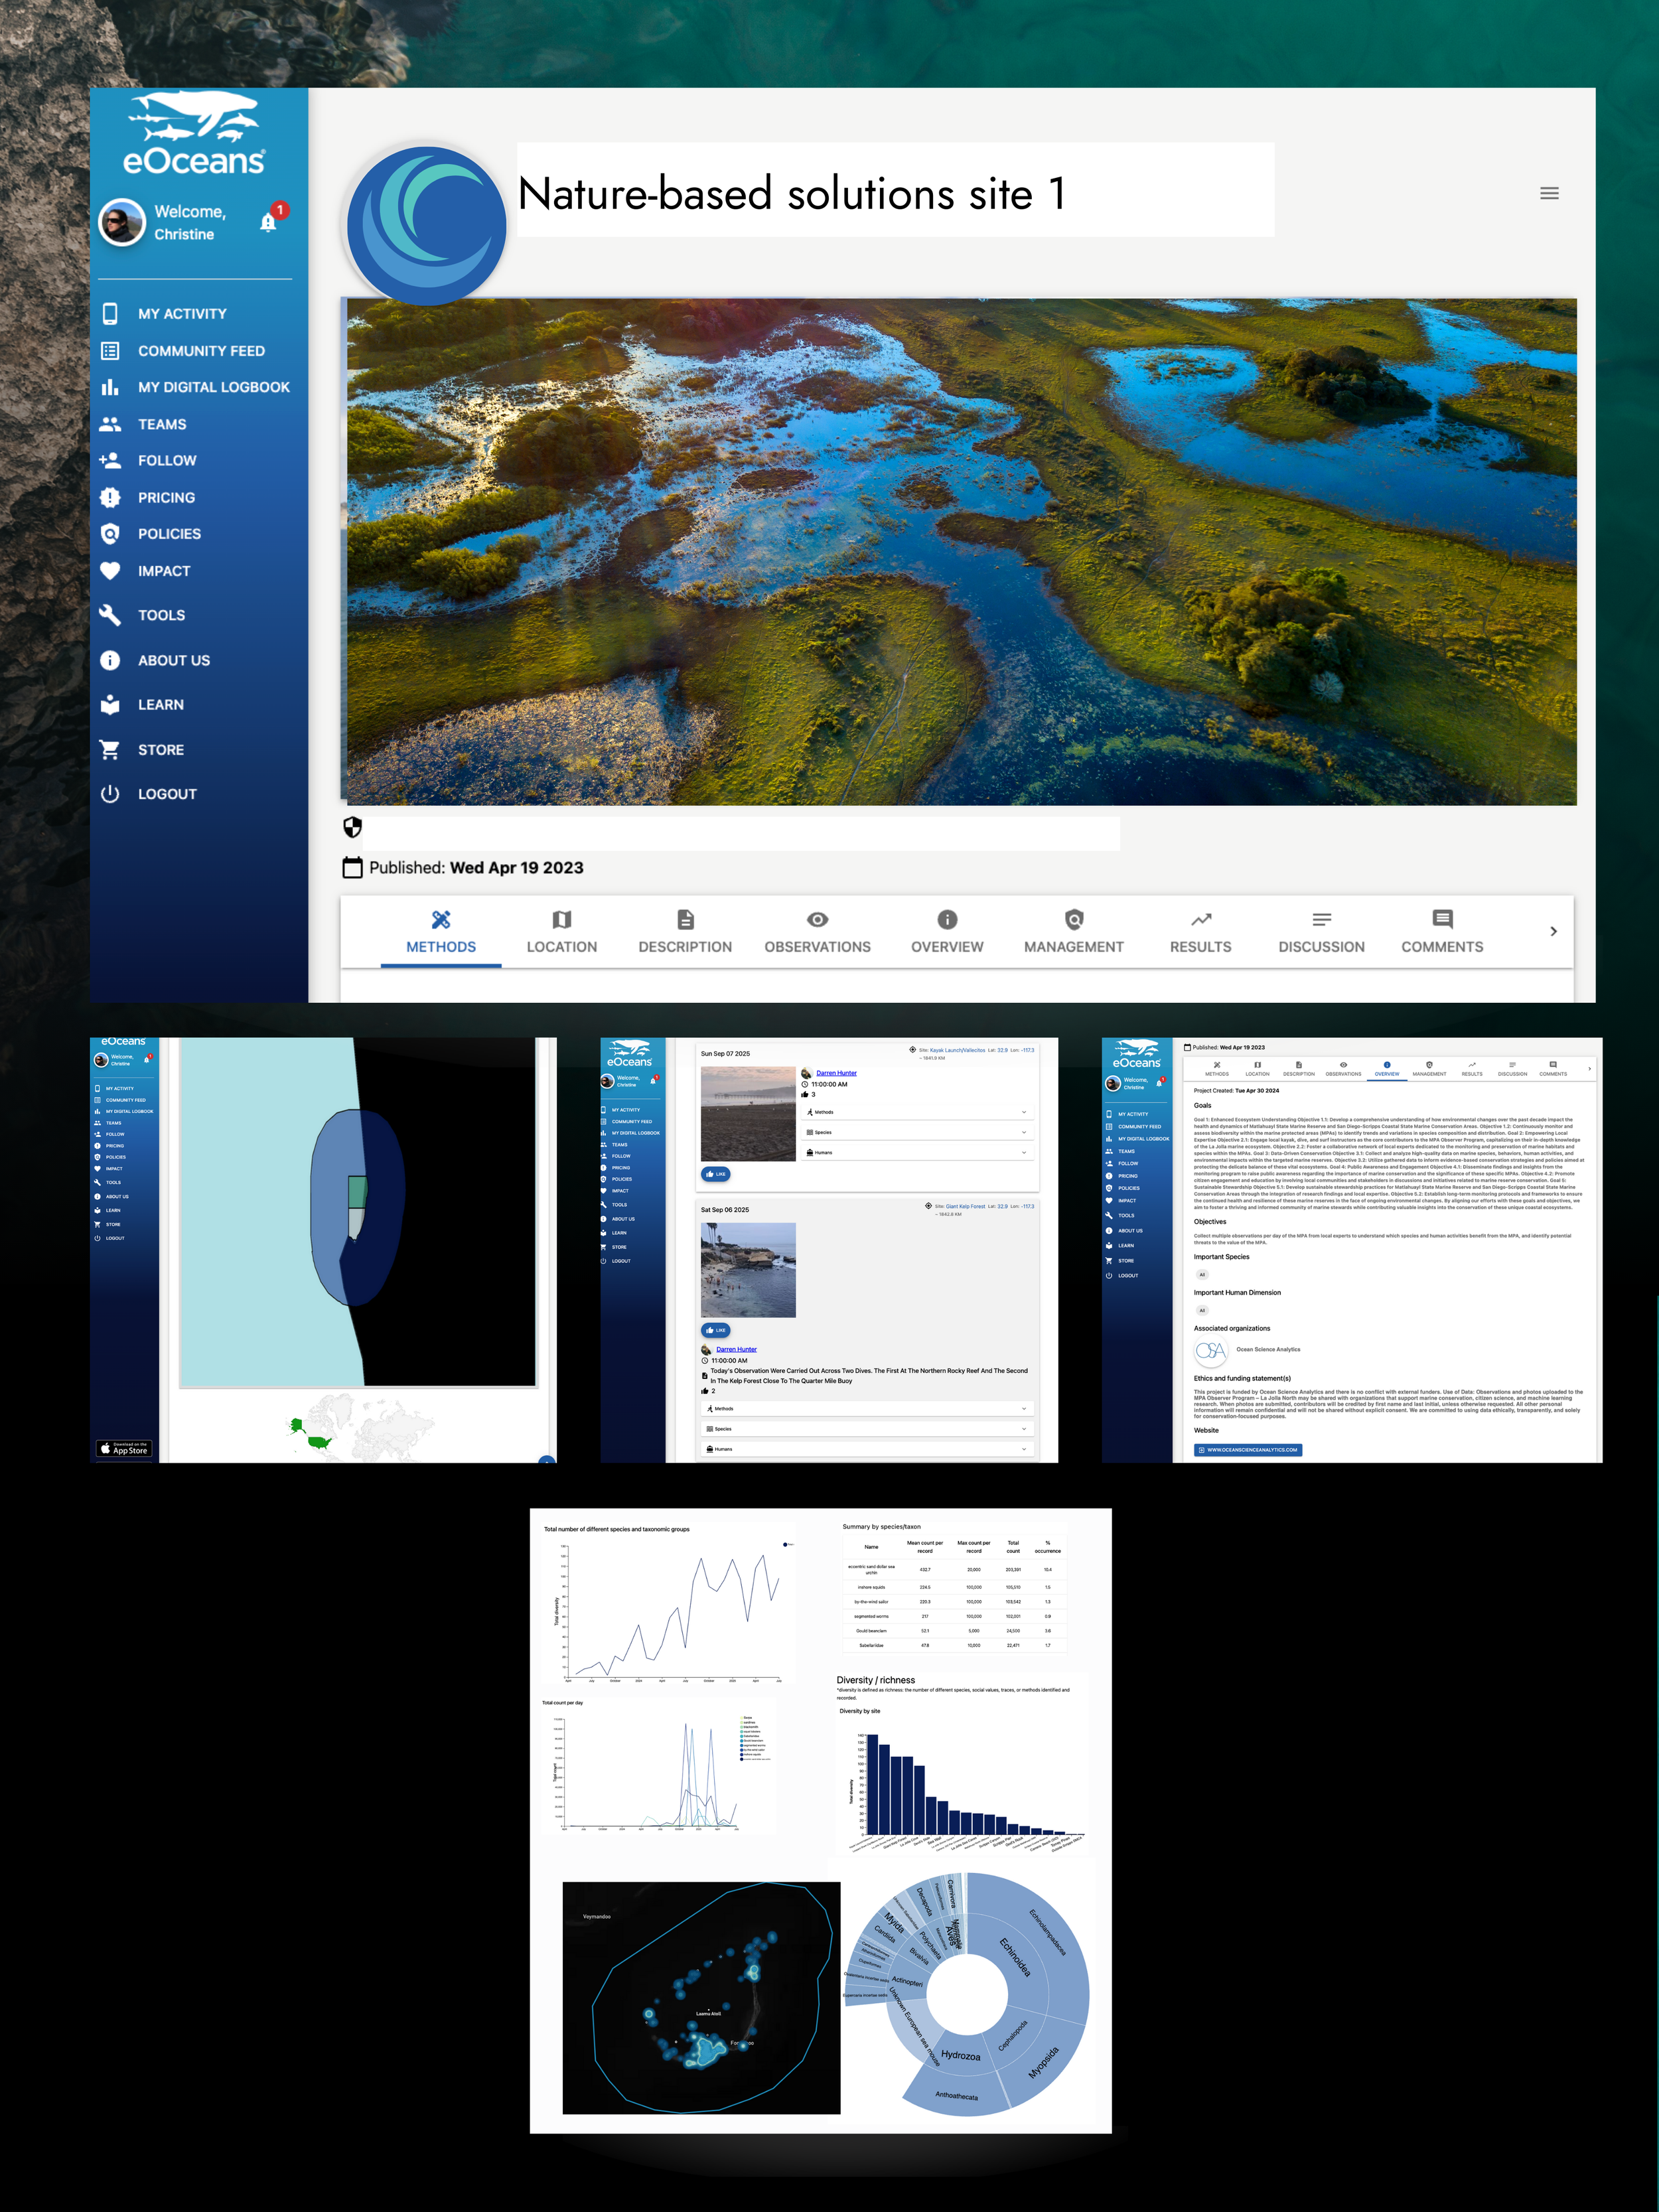
Define your project. Add your data. Generate validated insights and reports — automatically. As new data flows in, results update in real time.

✓ Better data, fast results
✓ Expand team capacity, efficiency
✓ Strengthen credibility, trust
✓ Cut time, operational costs
✓ Deliver high-quality results
✓ Simplify collaboration, break silos
✓ No custom apps, code, delays
✓ Maximum impact
→ Powered by eOceans®
eOceans® modernizes workflows — replacing fragmented, manual, error-prone tools like paper logsheets, spreadsheets, GIS, R, publications, and social media with one integrated, automated platform.
Built on FAIR+CARE principles and Darwin Core standards, with verified taxonomy and expert automation, eOceans unites diverse spatio-temporal and socio-ecological data streams — from field teams, sensors, eDNA, and more — delivering near real-time insights without the time or risk of traditional workflows.
eOceans can be used to assess and track biodiversity, pollution, fisheries, hazards, policy, and more in one no-code, expert-built system — accelerating reporting, de-risking decisions, and demonstrating impact with the transparency and accountability today’s missions demand.


For everyone—from small teams to global initiatives.
Teams of every size can collectively save millions of hours to drive their mission—with eOceans.
-
![Interior of a legislative chamber with many seated people, red curtains, and wood-paneled walls]()
Government Priorities, Investments
-
![Two people working at a wooden table with laptops, pens, and papers, discussing a project or document.]()
Nature Financing
-
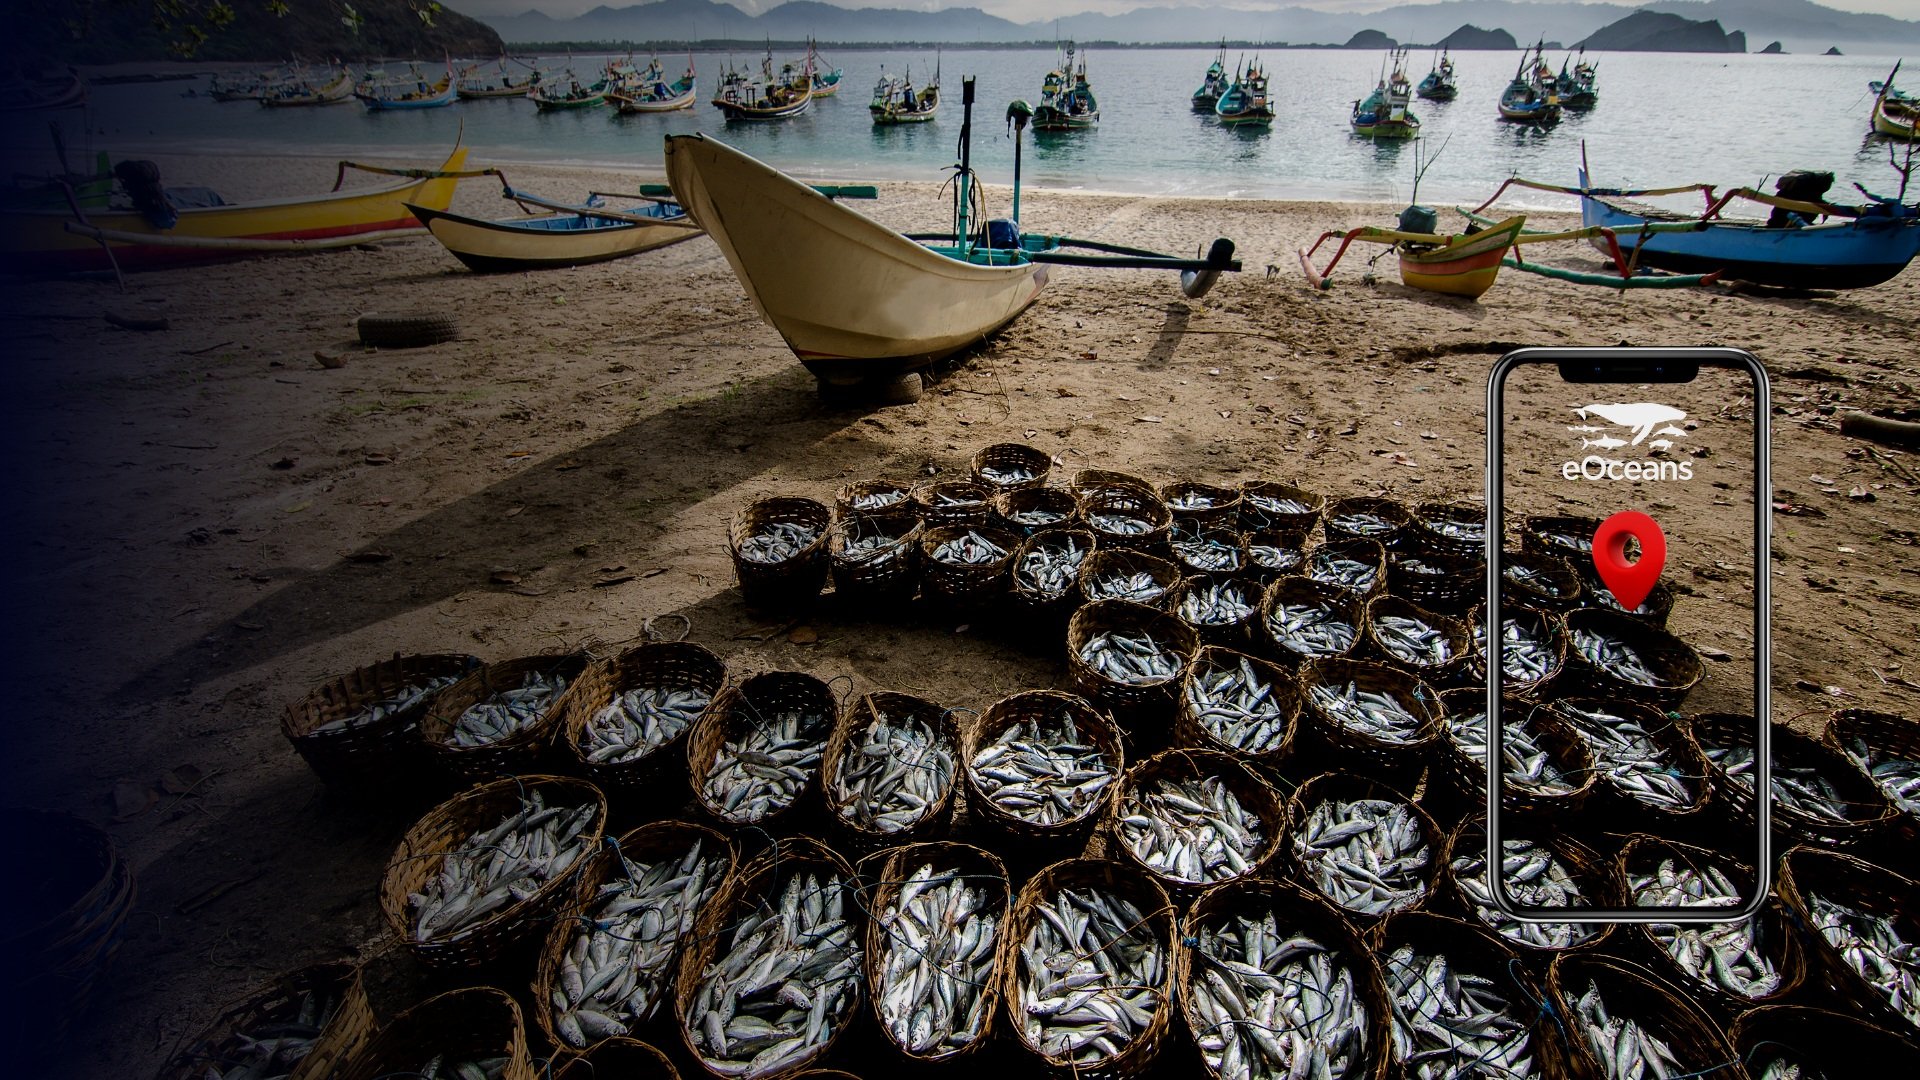
![Baskets of fish on a sandy beach with boats and the ocean in the background.]()
Fisheries
-
![Person snorkeling in a shallow mangrove waterway surrounded by green mangrove trees.]()
Nature-based solutions
-
![People cleaning up trash and debris along a beach during overcast weather, with mountains in the background and a dog in the distance.]()
Pollution Tracking, Mitigation
-
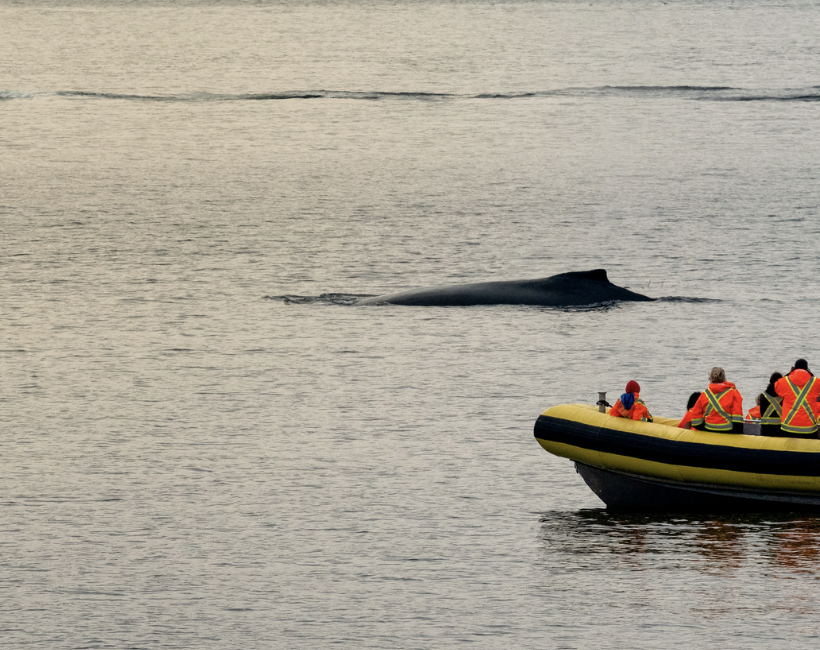
![People in a yellow lifeboat observing a whale near the water's surface.]()
MPA Assessments
-
![Six people walking along a beach with wet sand and tide pools, carrying fishing gear and looking towards the ocean under cloudy skies.]()
Invasive Species Tracking, Mitigation
-
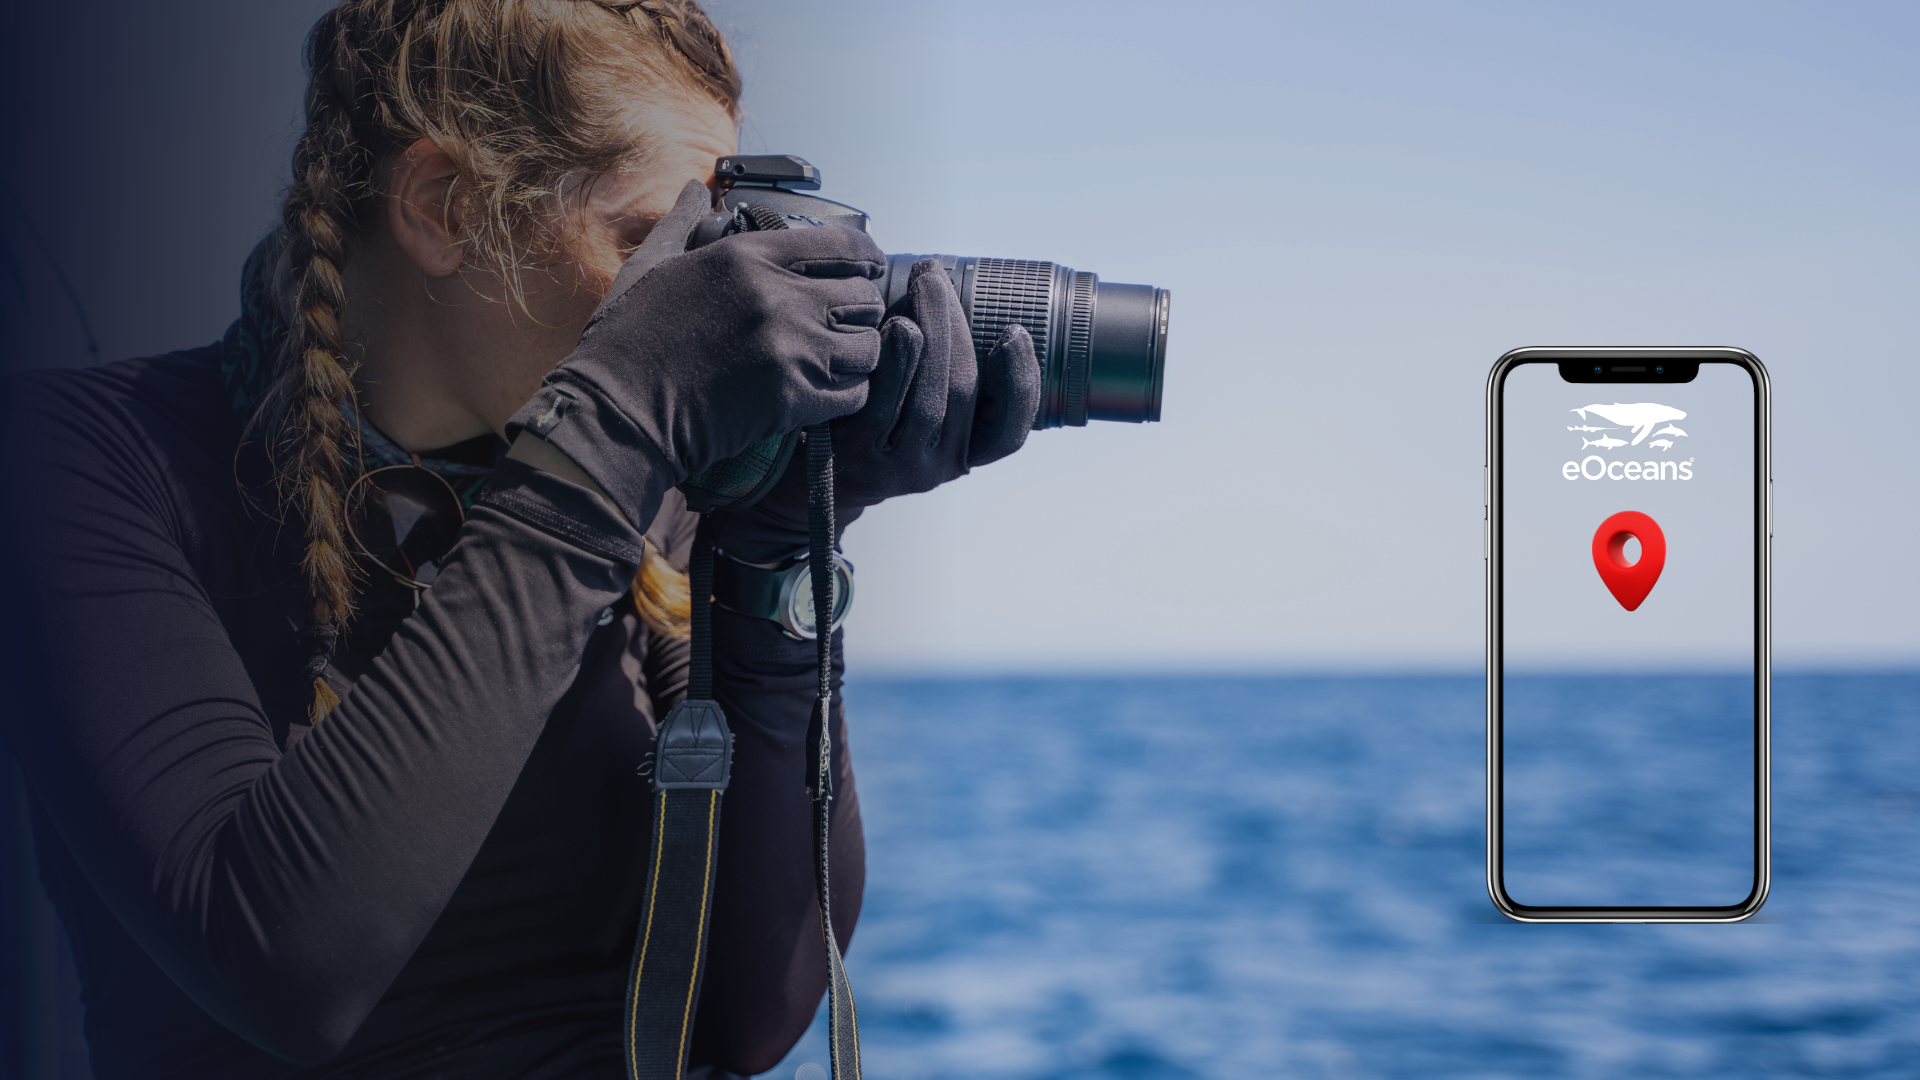
![A woman taking a photograph with her camera near the ocean, with a large smartphone displaying the eOceans logo and a location pin icon over the water.]()
Research Projects
-
![A whale breaches the water with its tail visible, and a boat in the background. There is a smartphone on the right side with the eOceans logo and a location pin icon.]()
Monitoring
-
![A drone flying over a lake at sunset with a colorful sky.]()
Surveillance
-
![Group of twenty-one people dressed in wetsuits and snorkeling gear on rocky shore near water, with forest and overcast sky in background.]()
International Collaborations
-
![People boarding a boat at the shoreline, with one person in a yellow shirt and red cap sitting by the water and others helping with the boat.]()
Consultants
-
![A safari vehicle with a person inside, parked in tall grass, watching a sunset over an African landscape with acacia trees.]()
Conservation
-
![Underwater scene with a school of salmon, including a prominent red and green salmon, and a smartphone with a map and the eOceans logo overlayed on the water.]()
First Nations, Two-Eyed Seeing
-
![An underwater scene showing a diver with fins and a snorkel, surrounded by sharks and other marine life. There is a smartphone displaying the eOceans app with a map marker icon.]()
Tourism Optimisation
-
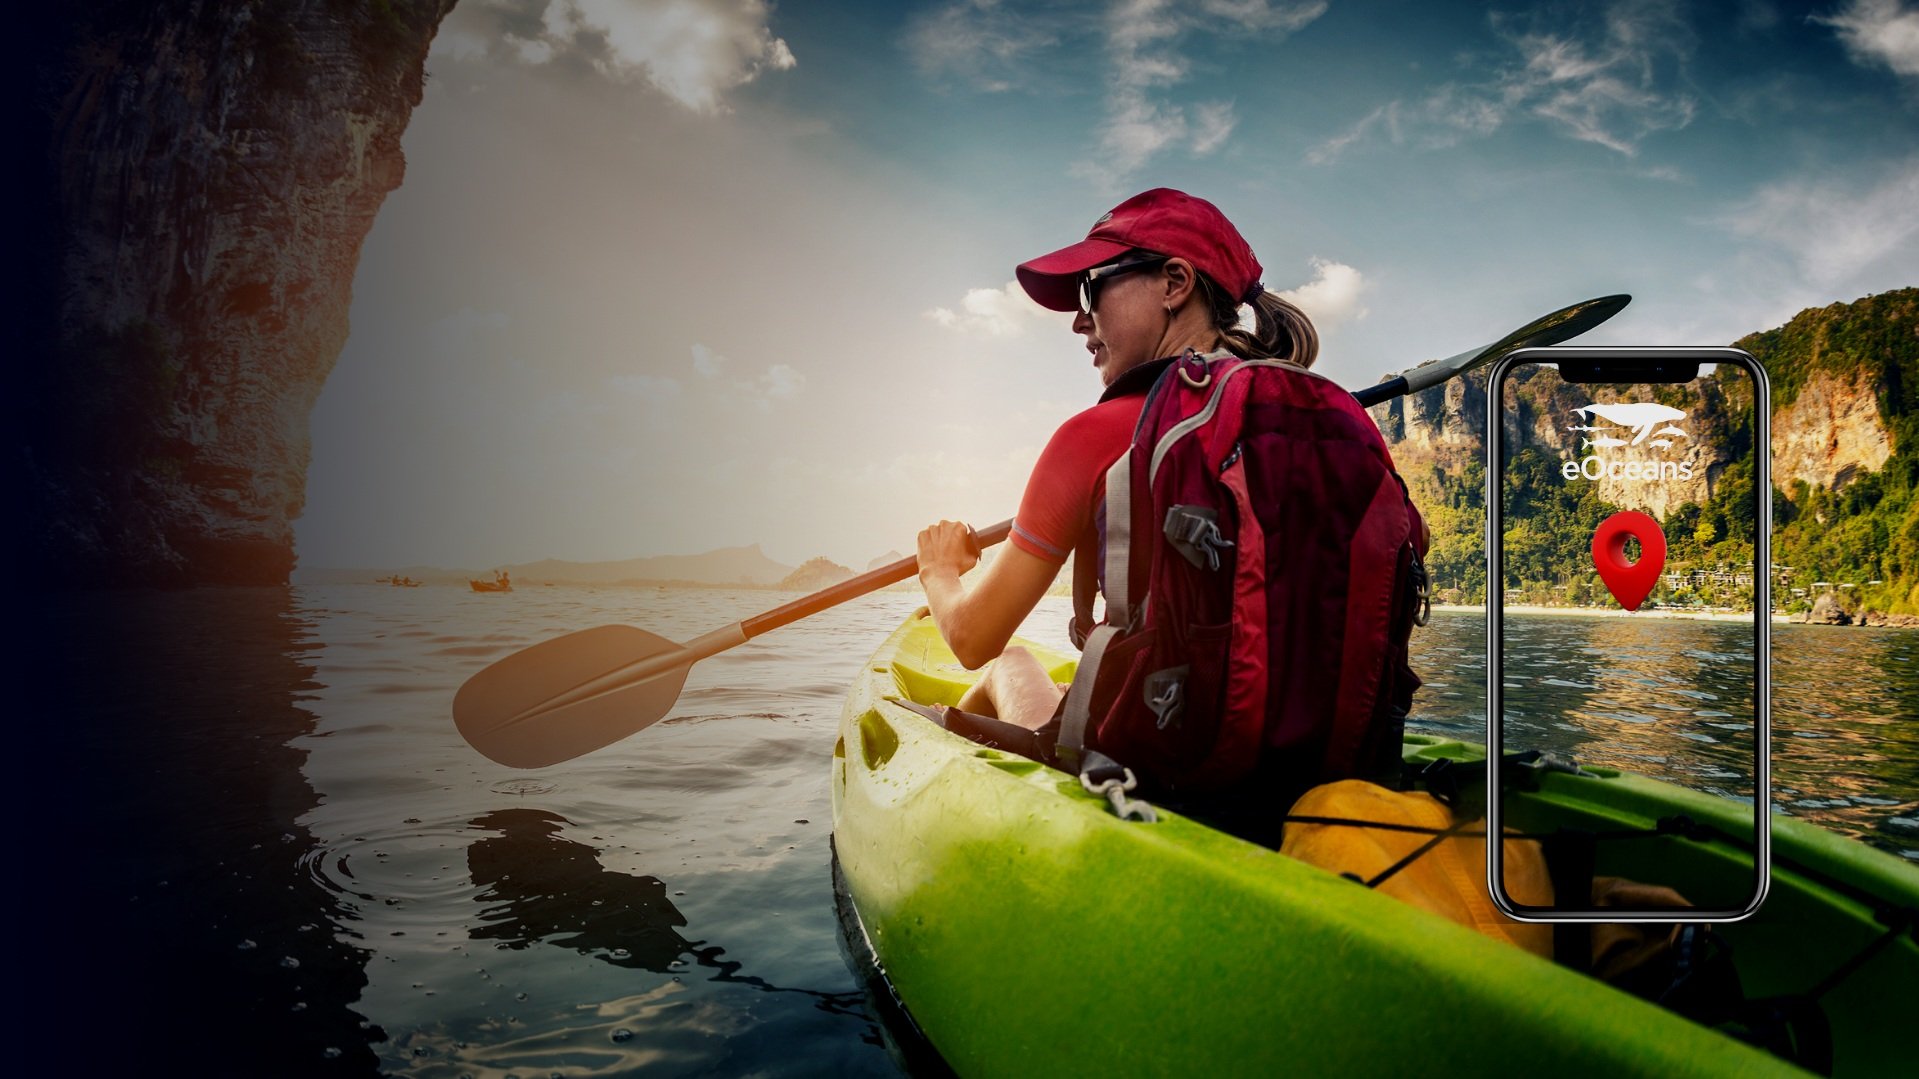
![Woman kayaking with a paddle in a green kayak, wearing a red cap and backpack, with a smartphone showing a map app on top of the kayak. The background features water, cliffs, and a partly cloudy sky.]()
Community Initiatives
-
![A whale's fin visible above the water with a cargo ship carrying logs in the background, with mountains and clouds in the distance.]()
Dynamic Management
-
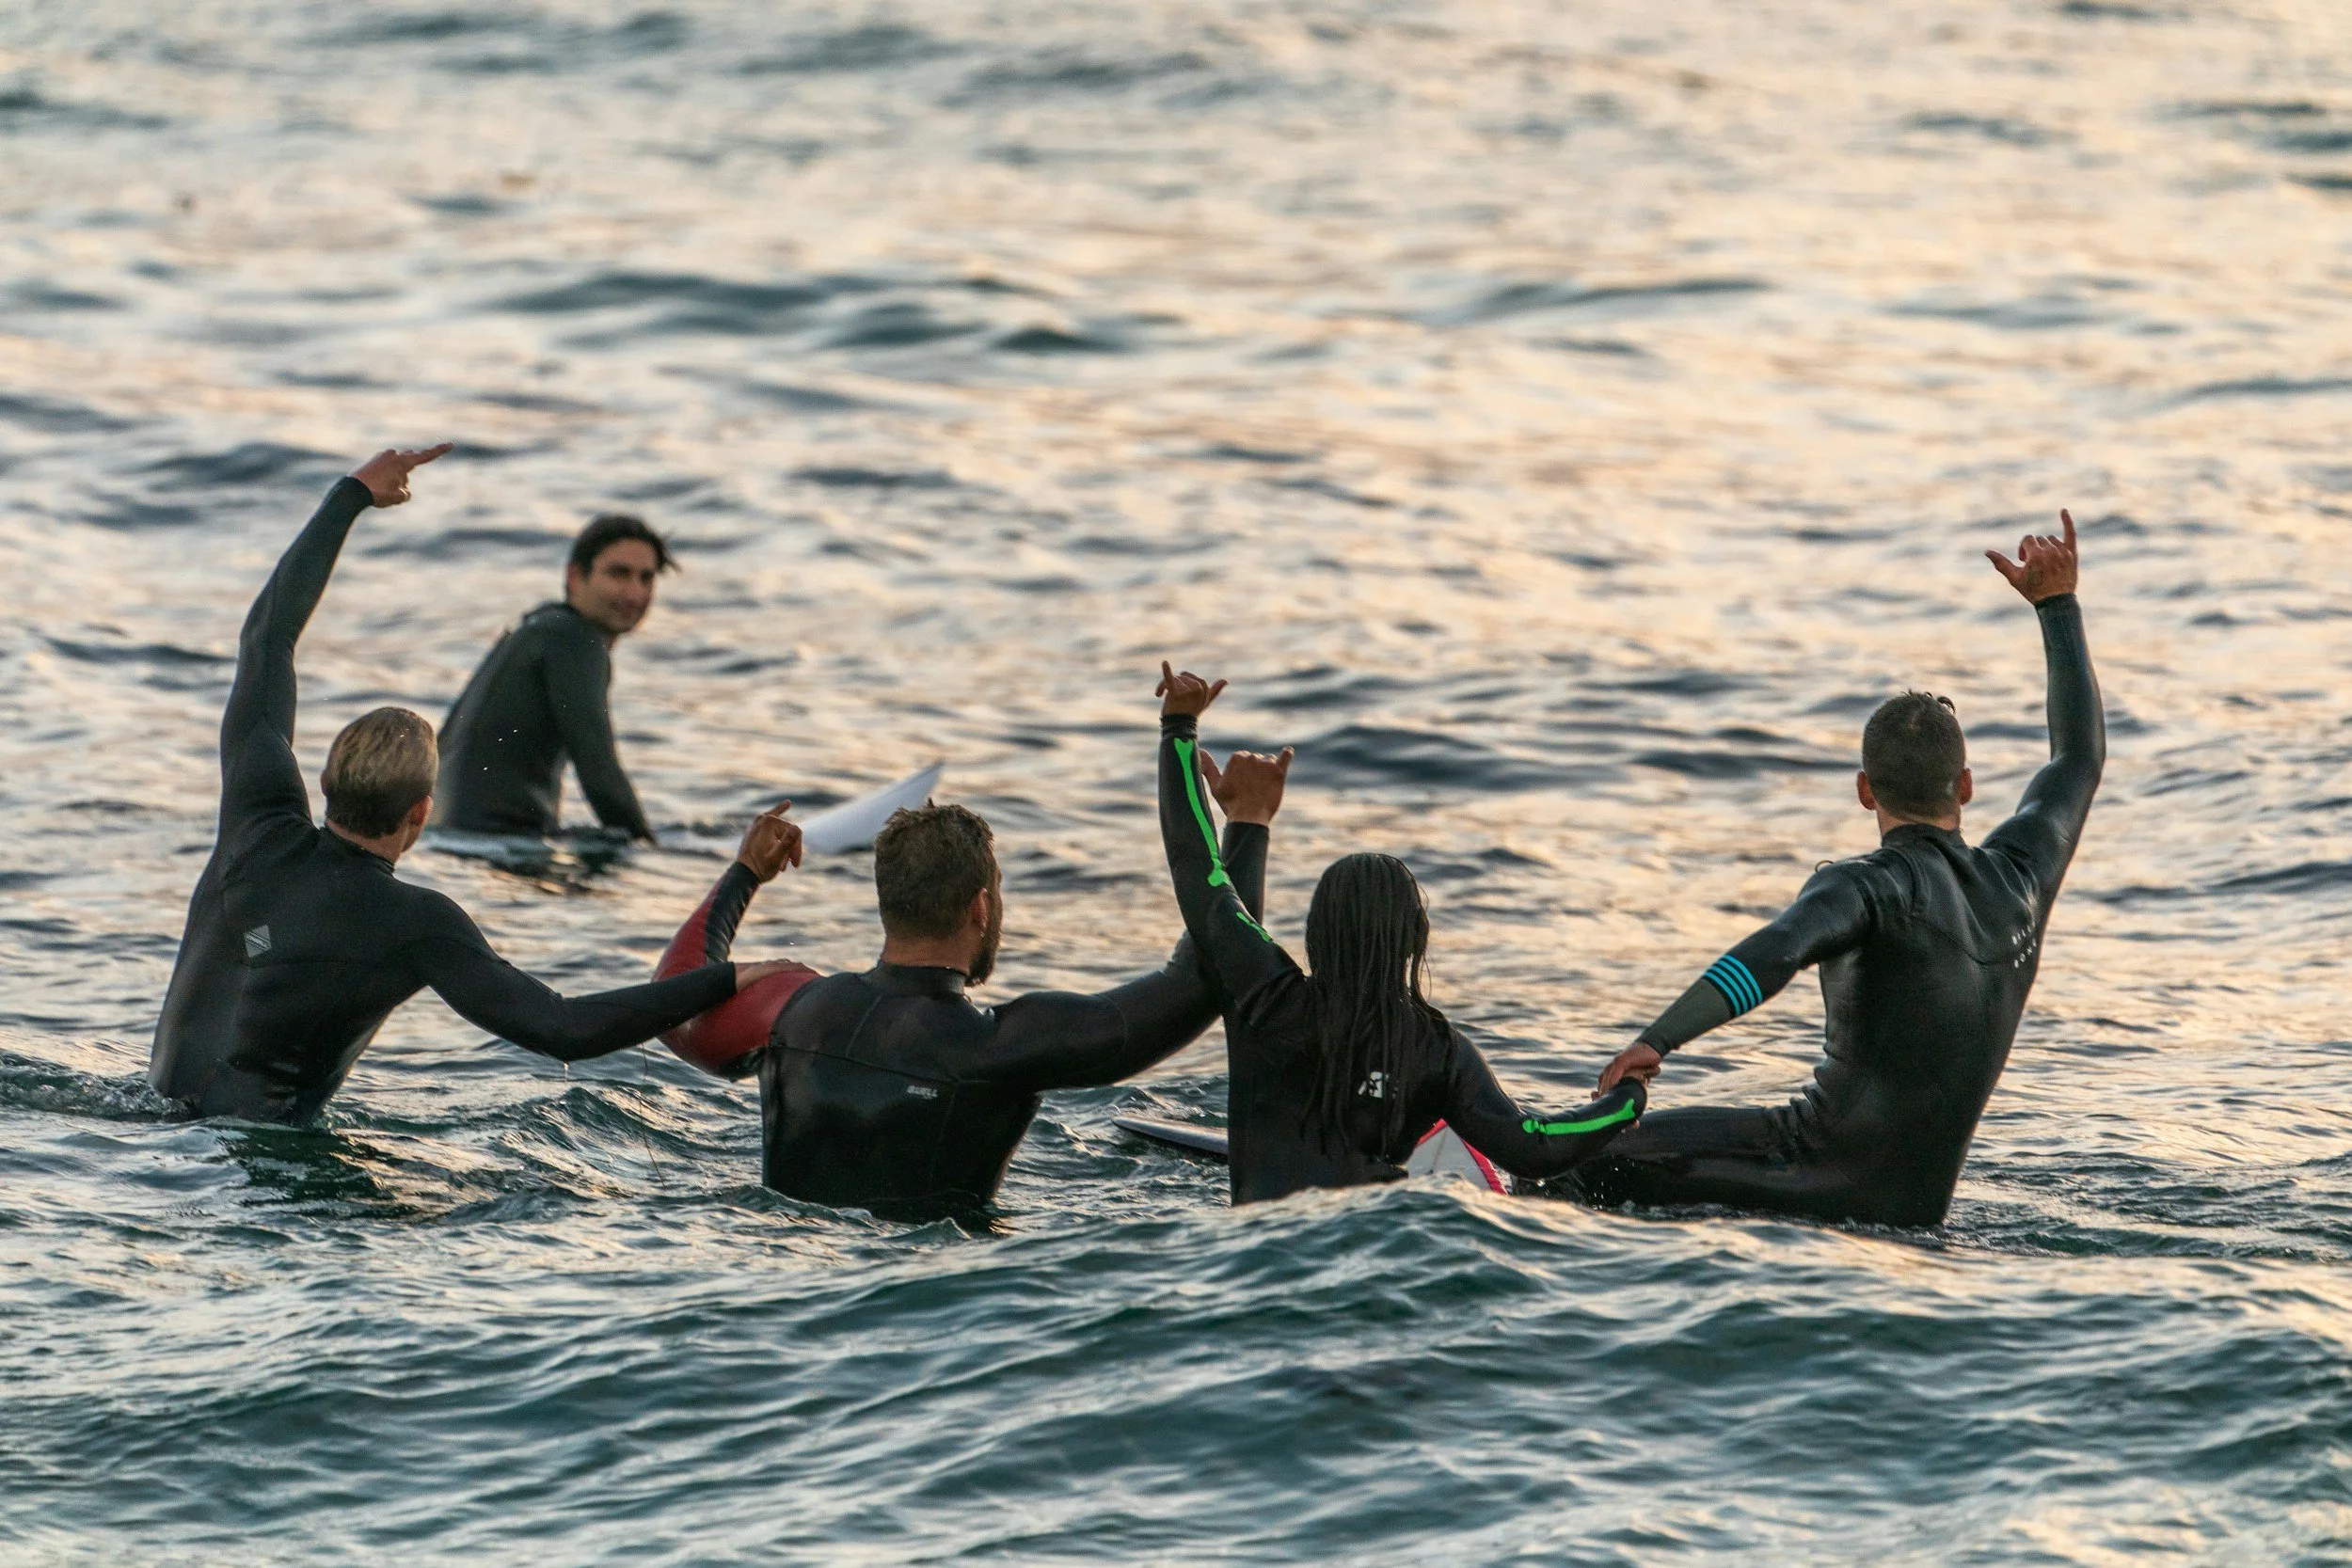
![A group of five people in wetsuits holding surfboards and making celebratory gestures while in the ocean at sunset.]()
Advocacy
-
![Close-up of a sea turtle swimming underwater with a smartphone overlay showing the eOceans app and a location pin marker.]()
Endangered Species Assessements
-
![Aerial view of a coastal area with numerous boats and yachts anchored in clear blue water. Surrounding the water are green, rocky cliffs and hills.]()
Smart Blue Economy
-
![A scuba diver swimming underwater near sharks, with sunlight streaming down from above, and a smartphone displaying the eOceans app with a red location pin icon.]()
Citizen Science Programs
-
![Silhouette of a boat on the water with birds flying in the sky and wind turbines in the background]()
Impact Assessements
-
![A woman and a child on a boat looking at the water near a rocky cliff with green foliage.]()
Education
-
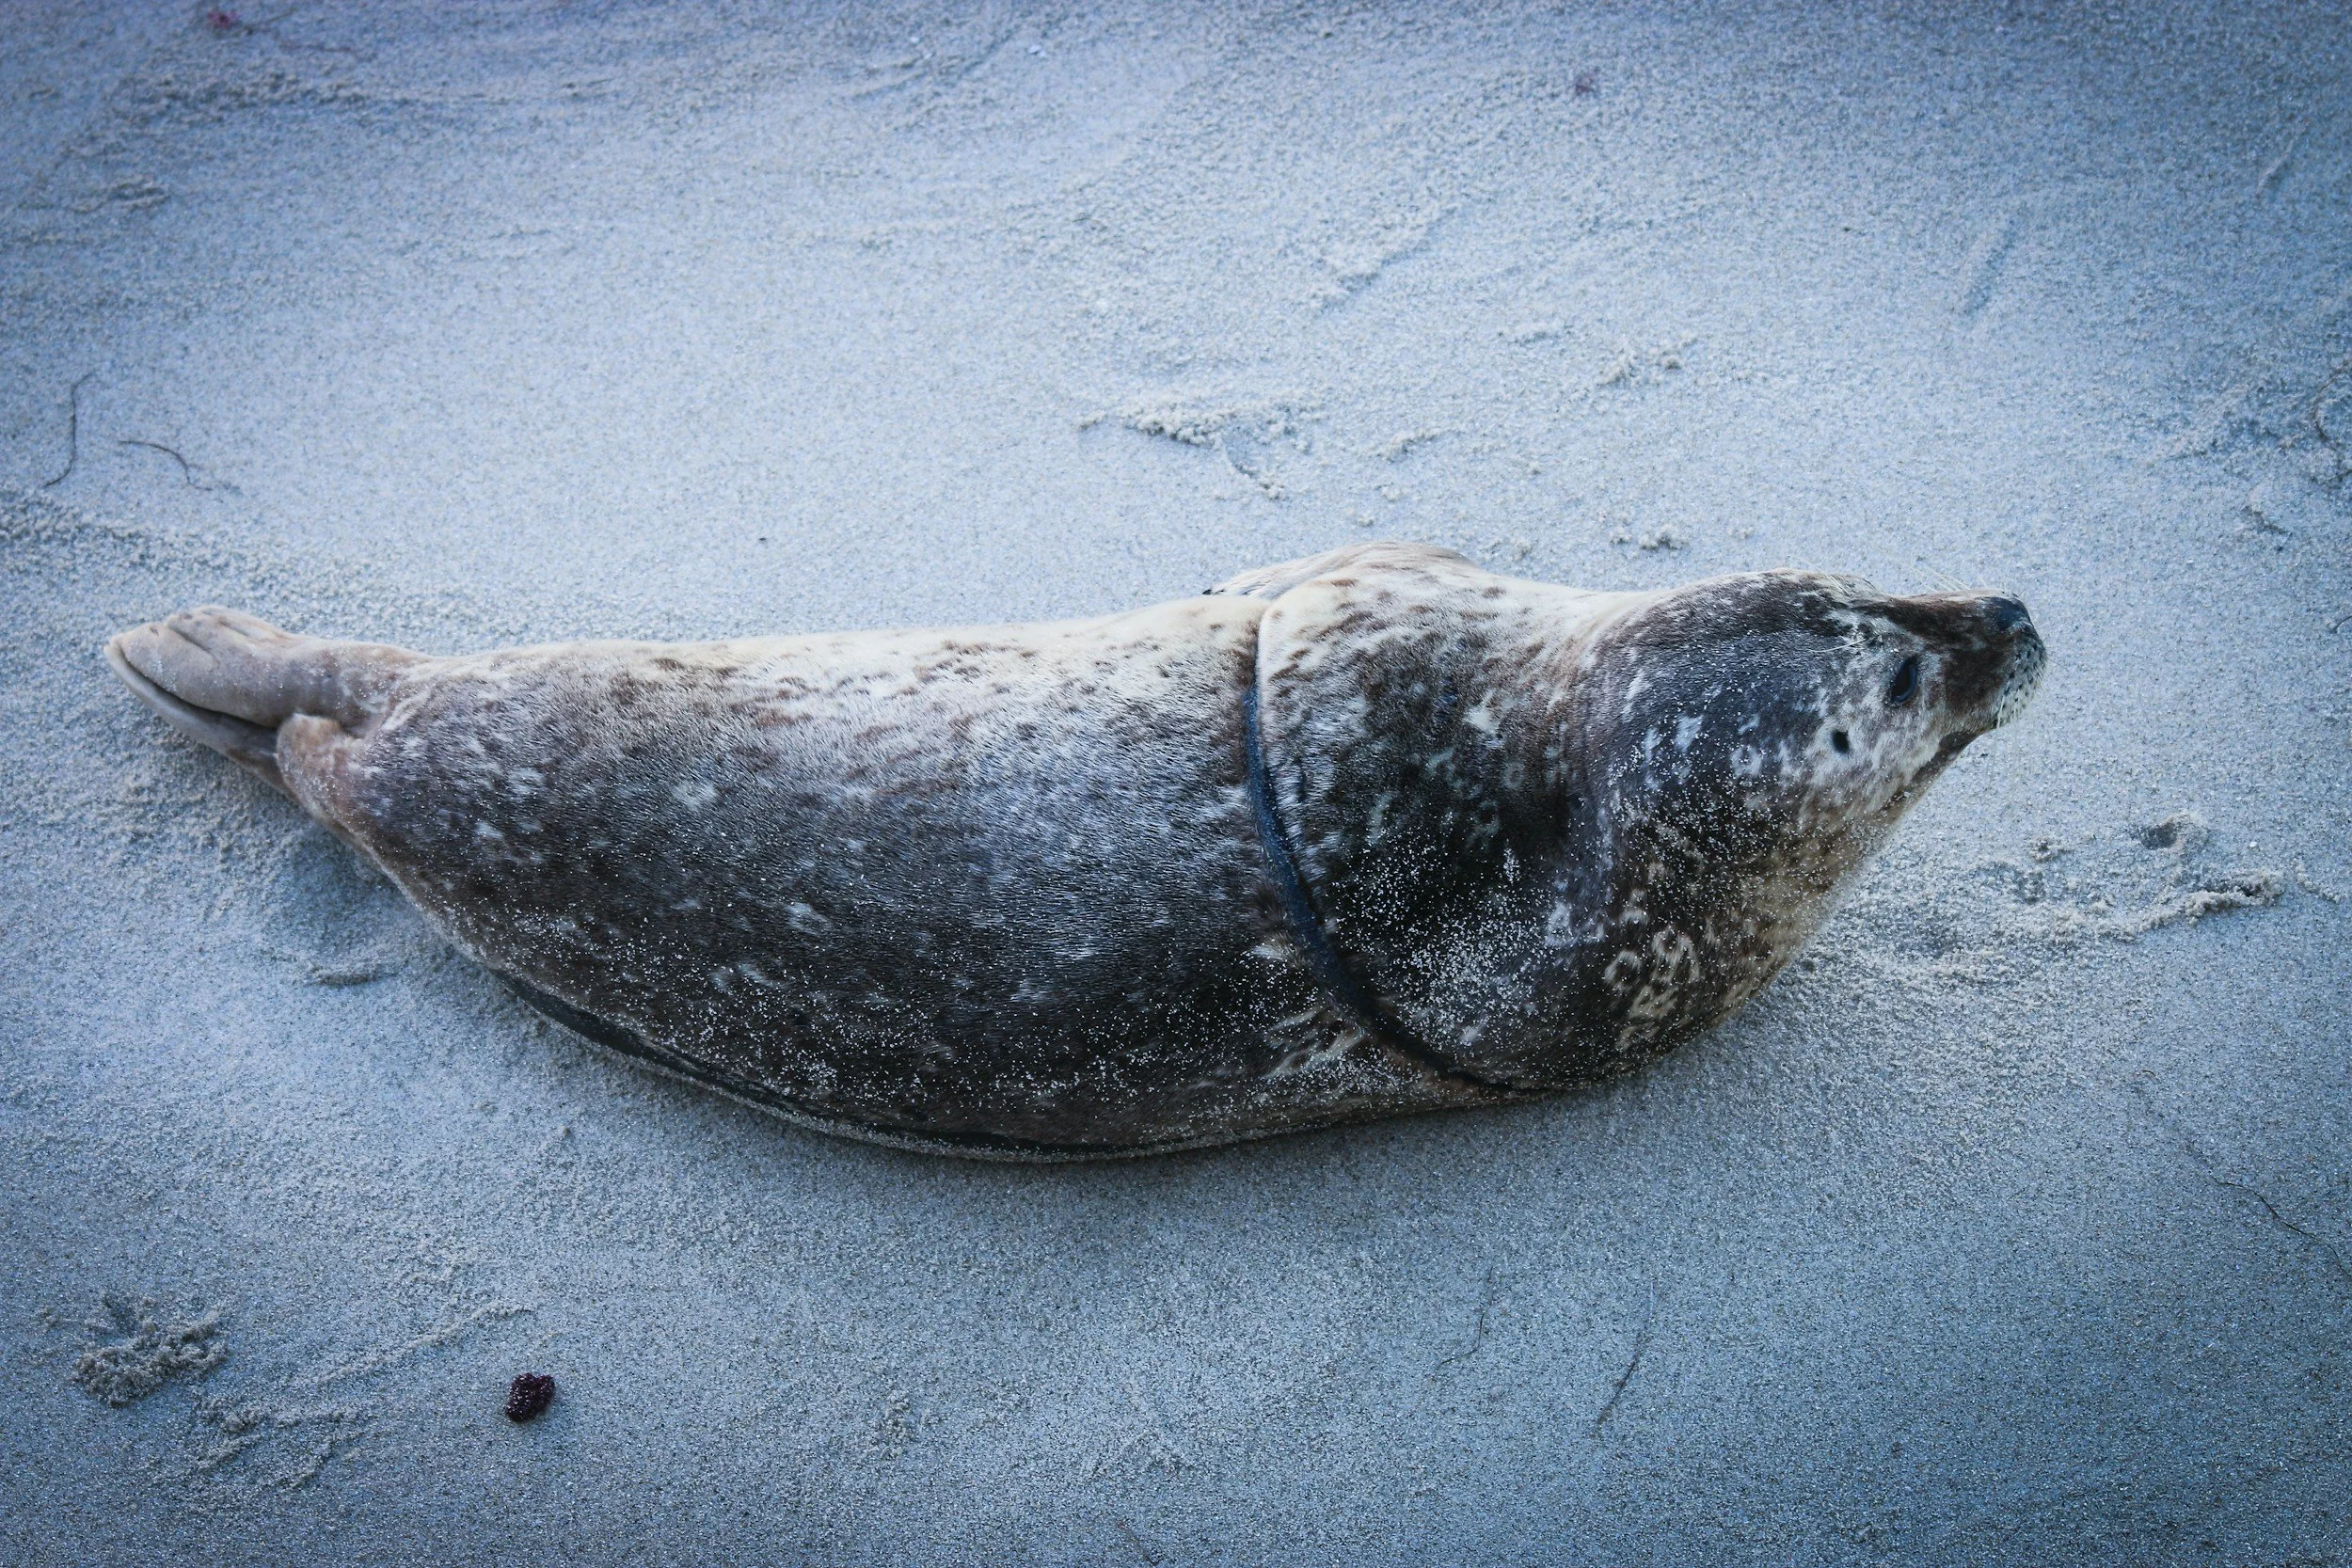
![Sealed and dust-covered seal lying on the sandy beach.]()
Marine Animal Response
-
![A large iceberg with a natural arch in the middle floating in the ocean, with a sailing ship nearby.]()
Hazard Monitoring
-
![Two police officers in uniform on a boat near water, with one officer leaning on the boat's structure and the other sitting, with water bottles and equipment on the boat.]()
Wildlife Management


Save time + Costs:
up to 80% reduction in manual tasks for data science, onboarding, metric tracking, reports
Do more with less:
safeguard long-term data from errors, poor wrangling, and loss
Build credibility + trust:
deliver expert-level results in a timely way to generate trust and new opportunities
Drive smart decisions:
inform business, investments, policies, careers, management, action with confidence
Scale effortlessly:
from one site or project to 1,000 without extra work
Unlock opportunities:
leverage insights for funding, career advancement, partnerships, risk reduction
Track everything, everywhere
Big or small, local or global—your projects can use any data sources, include any team members, and engage any collaborators.
1 billion+ variable combinations—
All metrics in one place
Your efforts, species, activities, biodiversity, pollution, social values, fisheries, policies, markets, diseases, engagement, and more.

Backed by experts—
Credibility your work needs
Built by PhD scientists — experts in socio-ecology, environmental monitoring, and policy — eOceans handles all your complex data tasks. It’s like having a million dollar data science team working full-time on your project.

Opportunities unlocked—
Act on insights, drive opportunity
With near real-time updates, eOceans reveals emerging opportunities—so you and your stakeholders can move faster and make smarter decisions, actions, and investments.

Data used, without delays—
Mobilise data, on demand
Magic Uploads™ turns your existing data into instant insights—helping you act faster, demonstrate impact, and build trust. Clean datasets can also be downloaded for maximum use and efficiency.

Scale—
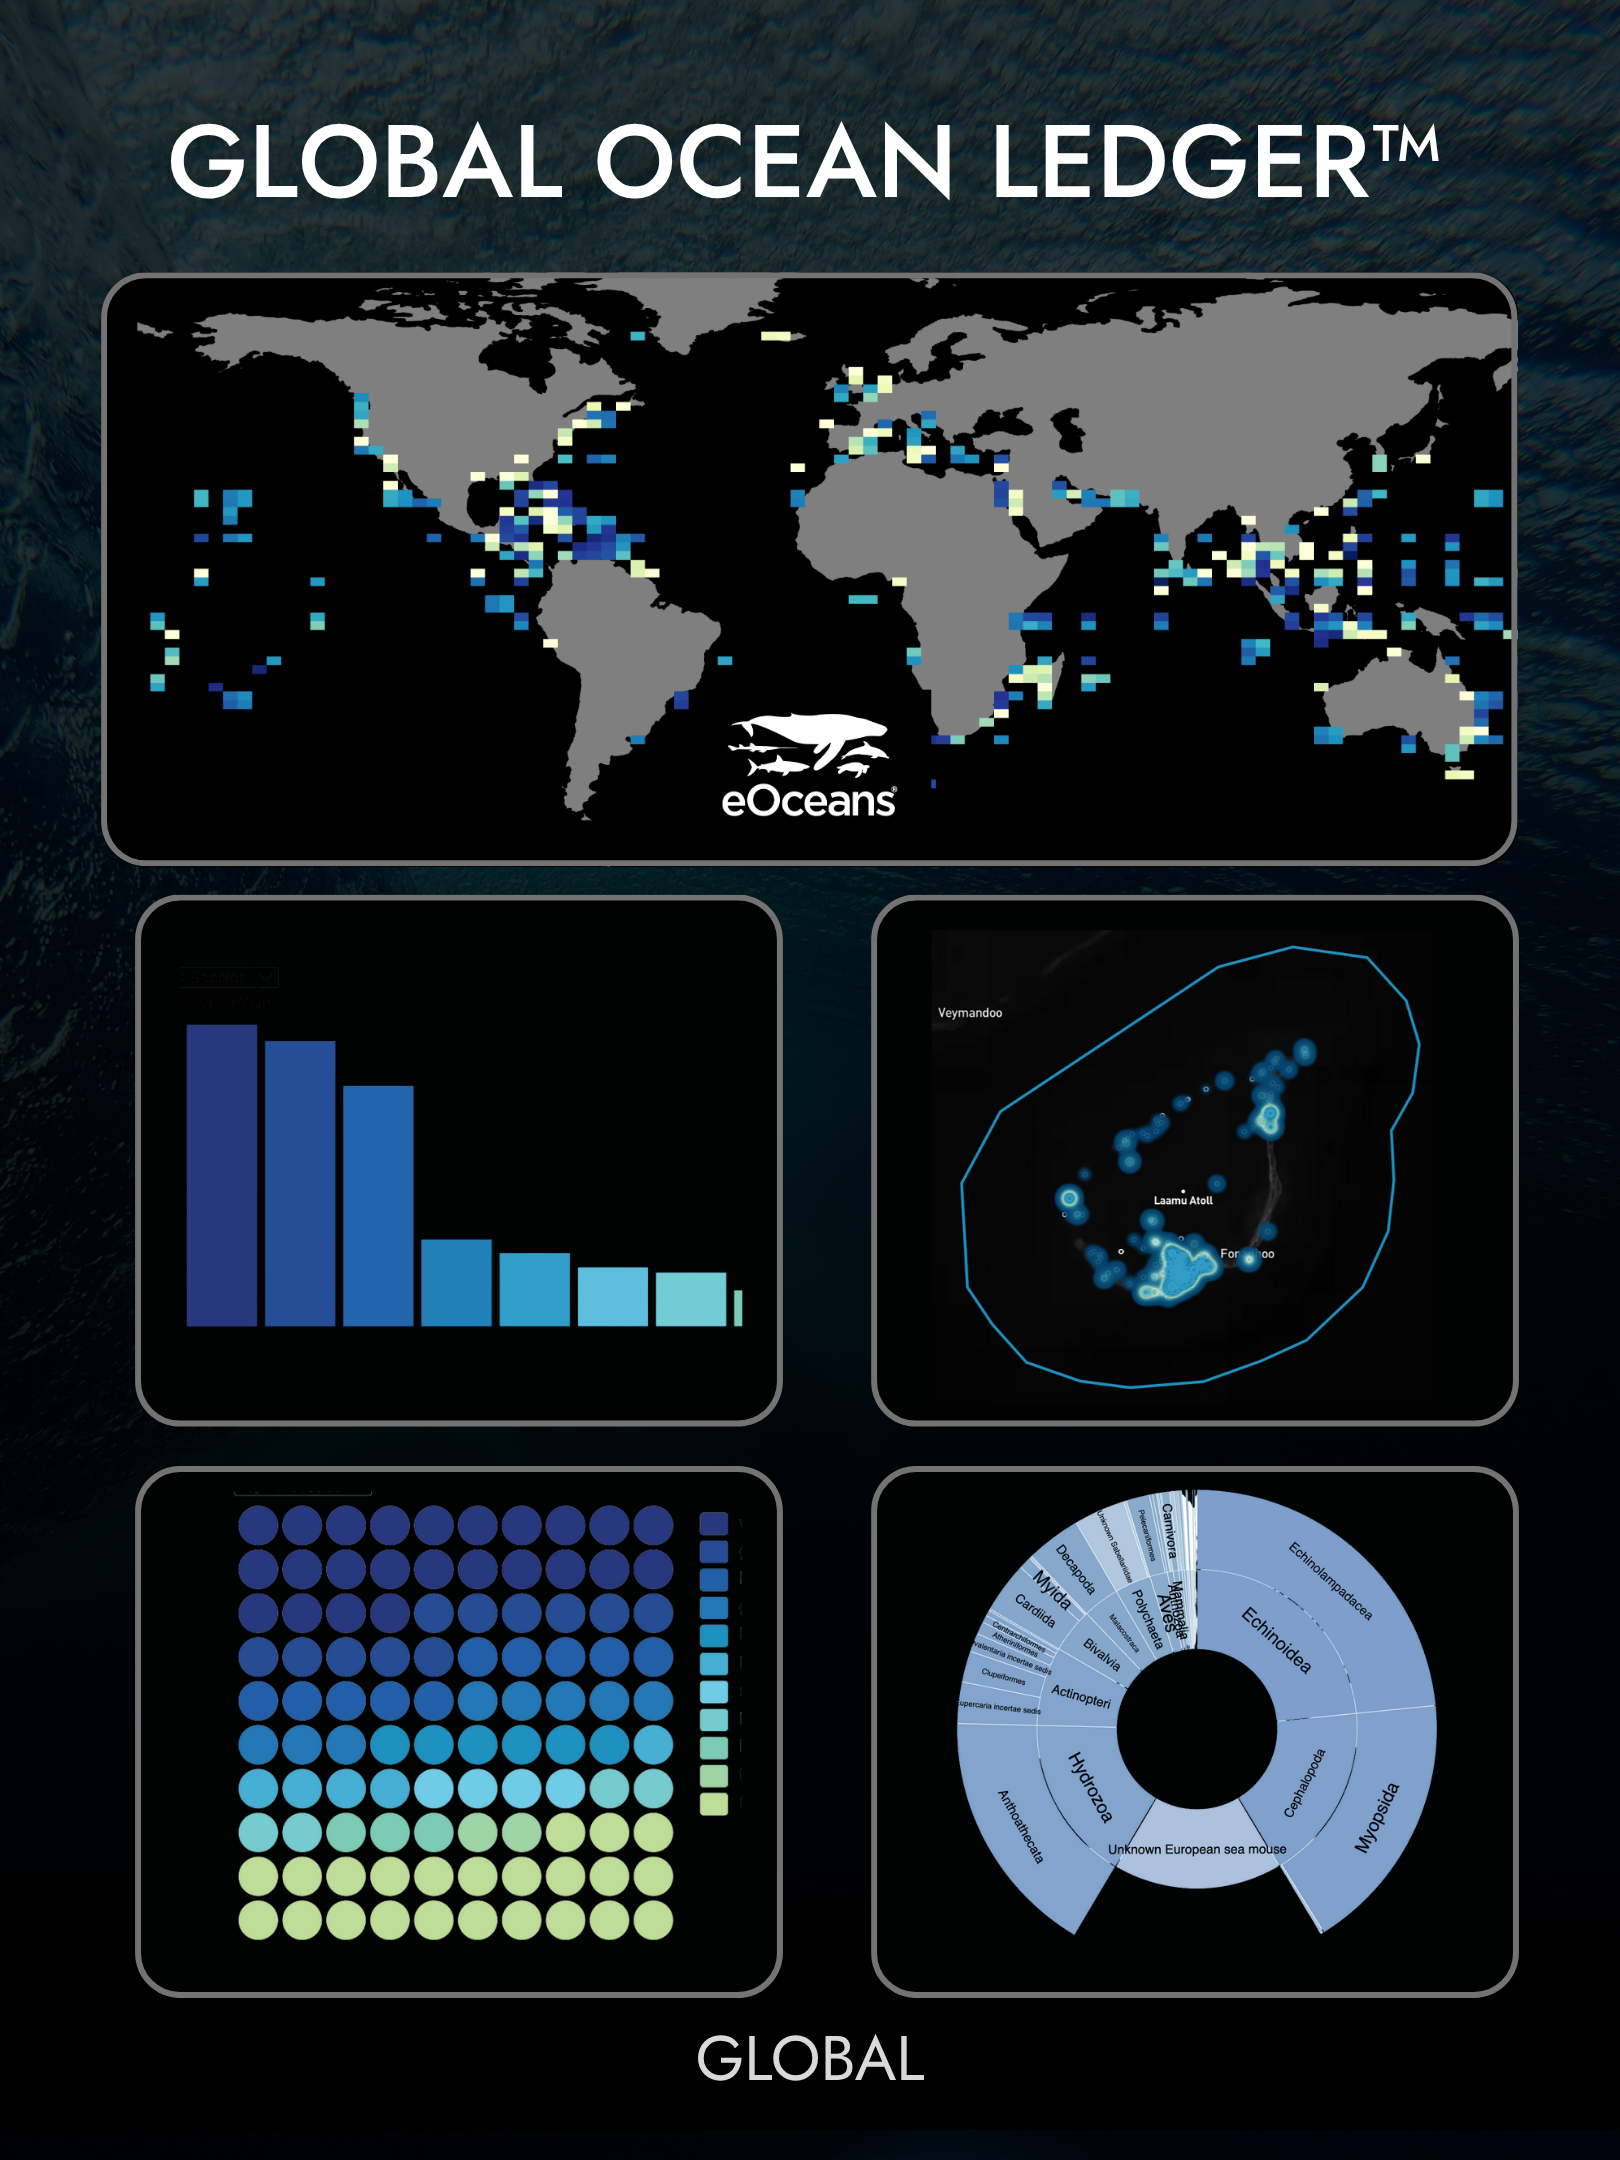
Collaborate locally, globally
With eOceans, it's easy to link efforts across projects, teams, regions, and scales. The Ocean Ledger™ and Global Biodiversity Ledger™ are built right in the app to make it effortless to set shared goals and track success.

All the tools, synced together in one place.

Old tools are not effective for today’s world.
-
![A person wearing a black and pink watch writing notes on a notepad, with a partially visible paper on the right side.]()
Paper logsheets?
Messy handwriting in the field, then hours spent re-entering data into spreadsheets—doubling the time and risk of mistakes.
-
![A MacBook Pro on a desk with a coding program open on the screen, and a closed plant book along with some pens and a folded cloth on the left side.]()
R and GIS?
Using R and GIS can easily eat up hundreds to thousands of hours.
-
![Close-up of a laptop keyboard and a portable external hard drive on a light gray surface.]()
Data to be used 'later'?
Data analysis reveals what’s happening and what’s needed—but most data goes unused, underused, or delayed. That’s wasted effort, costing time, money, credibility, and smarter decisions.
-
![Person holding a smartphone with a blank white screen outdoors]()
'Free' apps?
Nothing is ‘free’. A lack of research-grade ethics, especially in data, pose risks to species, places, or people if they are selling data or making the data open access. *Imagine a free nature-logging app that exposed or sold the exact sites of sharks, pangolin, or abalone—they’d be gone pretty quick.
-
![People working on computers in an office, one person focused on coding on a monitor.]()
Consultants?
If you don’t have in-house data science experts, expect to spend $60,000–$150,000+ per project—and still start from scratch next time. Efficiency is key.
-
![Two women working at a desk, one with short gray hair pointing at a computer monitor, the other with dark hair looking at the screen, in an office with a colorful poster on the wall.]()
In-house data science?
Just one data scientist can take 8 months to execute even a small data project—at $100/hour, that’s $140,000. Shouldn’t their time be spent on important tasks, not on basics like data cleaning and exploratory analysis?
-
![Desk phone on a black office desk with computer monitors in the background.]()
Phone hotlines?
Many organizations still use phone hotlines for public reports—animals, injured animals, pollution, illegal activities, invasive species, and more—but the experience is frustrating, leading to apathy, underused data, and growing conflict.
-
![]()
Guessing, without data?
Decision making—without analysed data—means you are left guessing. What’s the cost of getting it wrong?


Meet eOceans.
Clients, Partners