
In 2011, the Fijian dive tourism community reached out to collaborate on describing their shark populations. They did this because scuba divers in Fiji love sharks, dive tourism businesses depend on healthy shark populations, and they were concerned that sharks were being overfished and needed protection.
But, they didn’t have the numbers…What species? Where? What months? What are the baselines? Threats? etc.
The community united together to document their shark observations on every dive – including zeros – eOceans supported the survey design and performed the analysis, and they co-wrote the paper.
Today, this “Magnum Opus of citizen science”, as one of the reviewers called it, was published by Pacific Conservation Biology.
With over 146,304 shark observations from 30,668 dives on 592 sites, it was an incredible participatory science project that produced many novel findings.
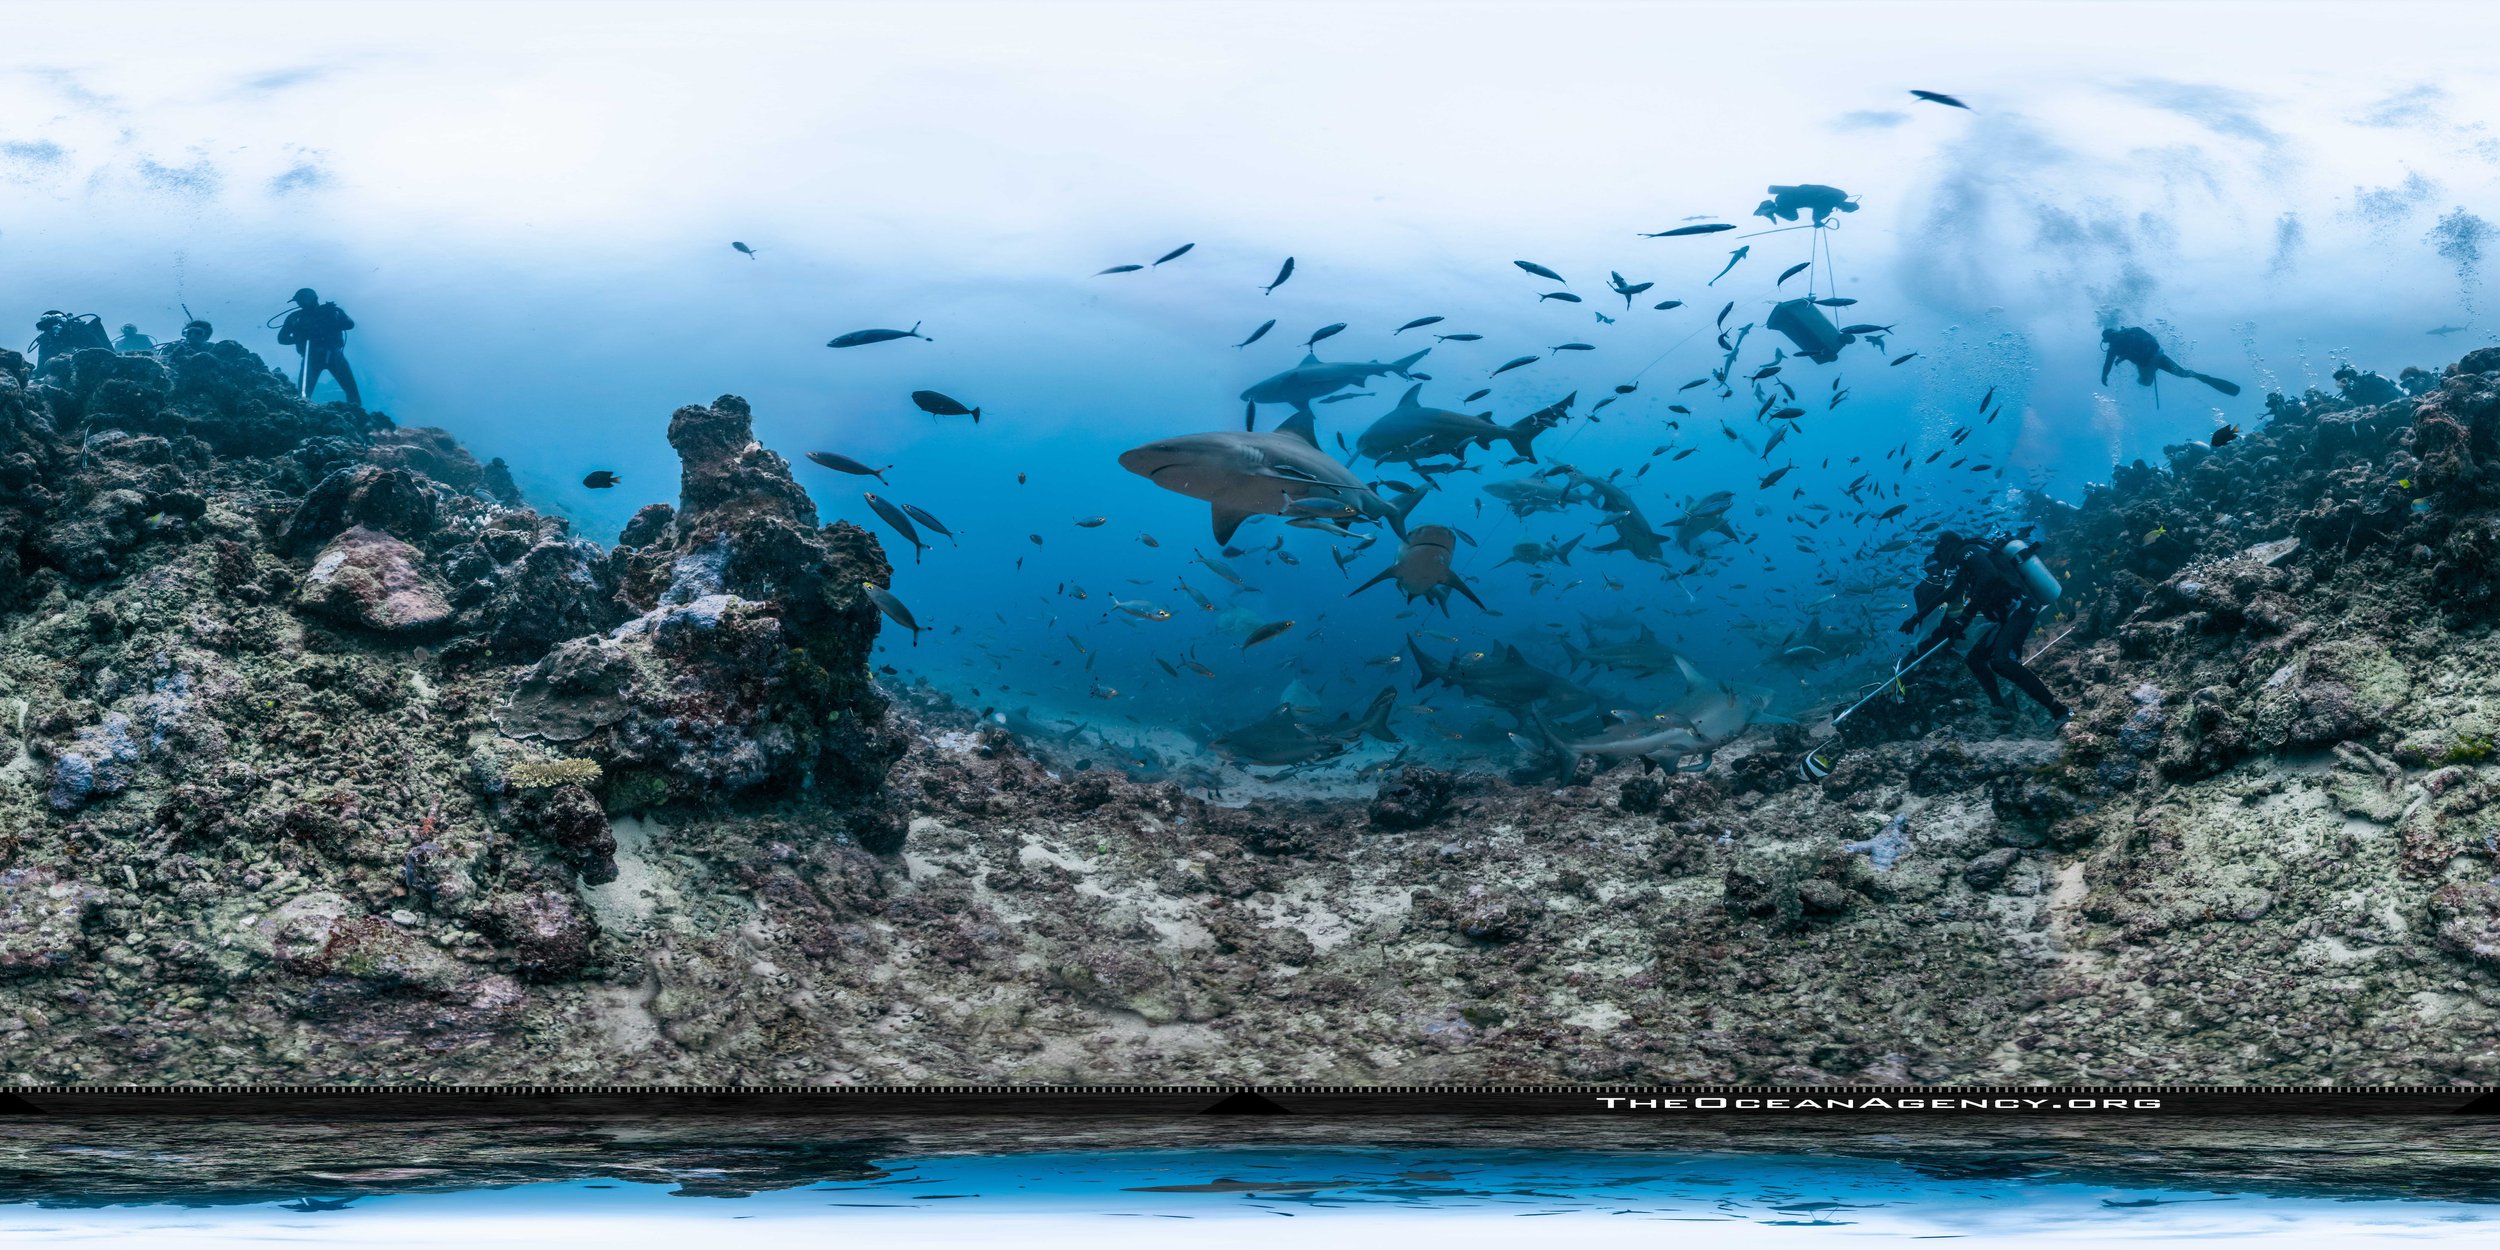
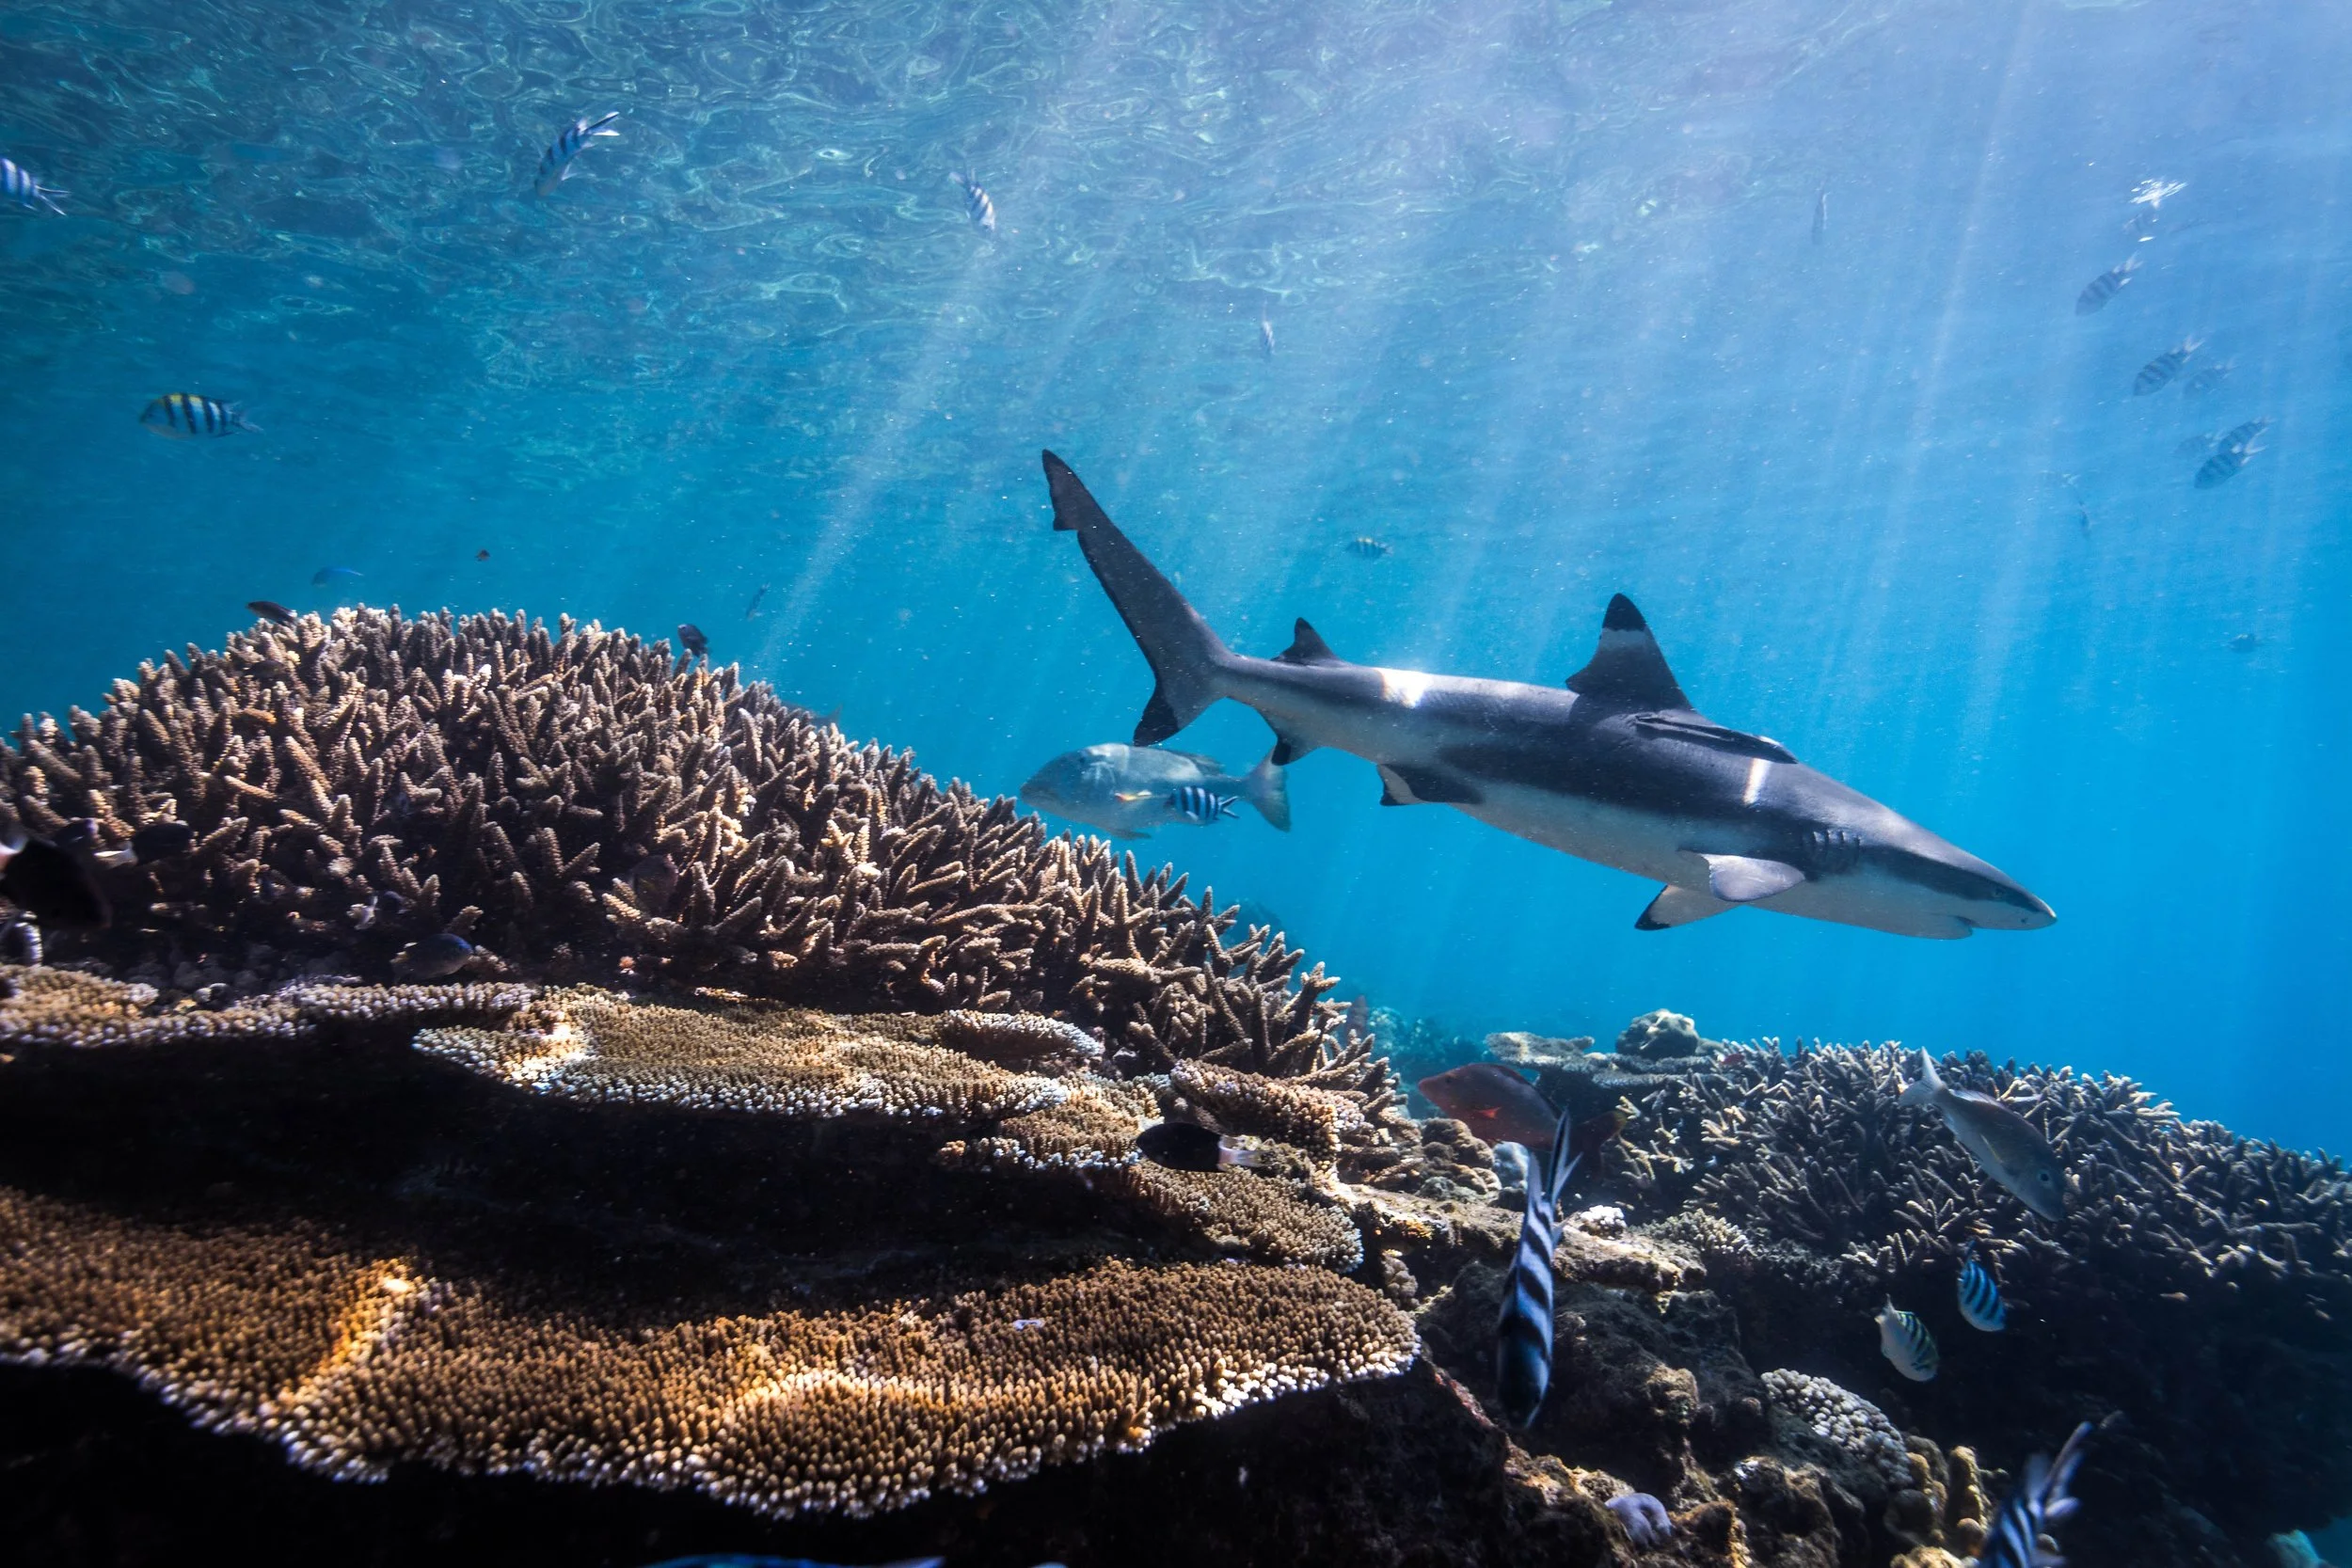
Divers in Fiji love sharks, and shark diving contributes more than USD$42-million annually. Shown here is the famous Beqa Shark Dive, Fiji. Photo: The Ocean Agency / Ocean Image Bank
Why sharks?
Scuba divers and snorkelers love sharks!
Dive operators across Fiji offer incredible dive opportunities to their guests who flock to Fiji from around the world. Sharks, along with crystal clear waters and high marine biodiversity, are the main attractions.
Shark-specific dive tourism in Fiji is valued at USD$42-million annually.
So, alarms rang when they noticed sharks disappearing in many locations and they also observed sharks being fished and sold in local and international markets. This prompted the dive community to quantify their sharks to better understand their distributions and to have the results they need to advocate for science-based conservation.
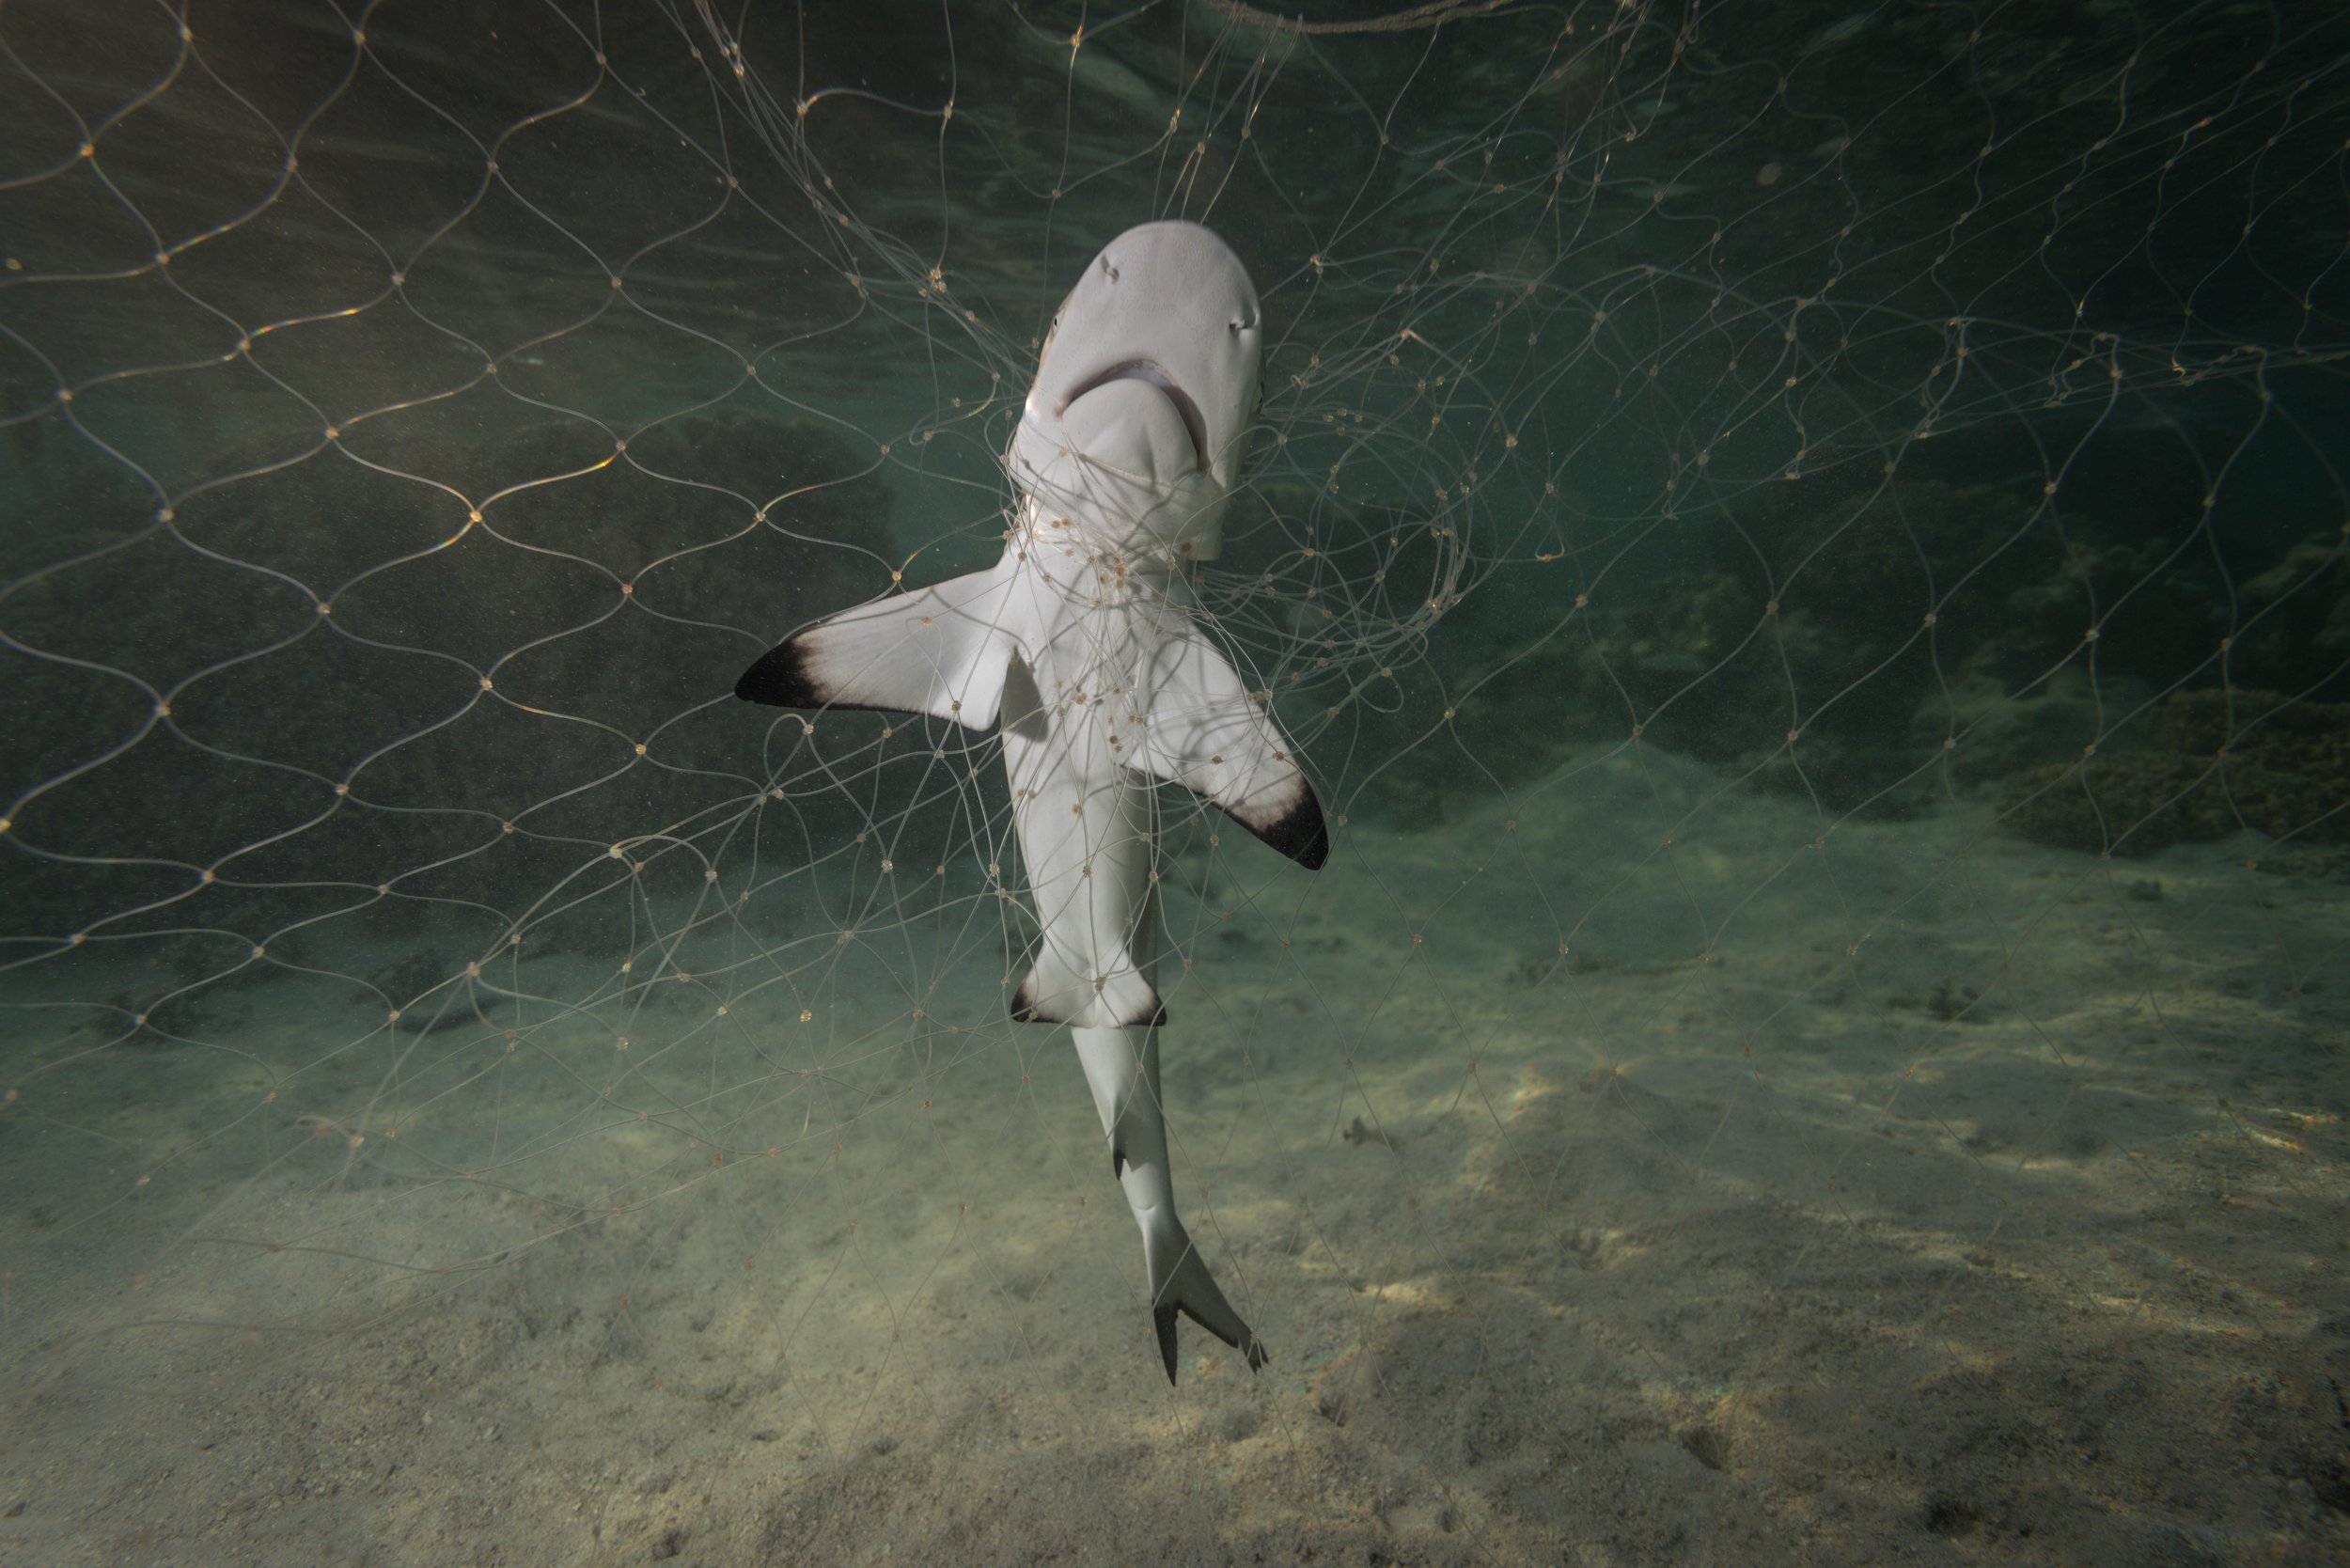
Shark caught in fishing net, Fiji. Photo: Tom Vierus / Ocean Image Bank
Launching the Great Fiji Shark Count.
The Great Fiji Shark Count was urged by Beqa Adventure Divers — home of the “The best shark dive in the world”.
eOceans founder, Dr. Christine Ward-Paige, had just finished a PhD that documented the value and limitations of using scuba divers’ observations to track shark populations. She had also just begun eShark and eManta, to crowdsource observations from ocean explorers to track global shark and manta ray populations and their threats. So she was keen to support the idea of the Great Fiji Shark Count (GFSC) when they reached out.
First, we co-designed the surveys and datasets needed to describe and track shark populations.
Then, we created a community logbook. A binder with paper log sheets was mailed to all participating dive operators for dive guides and their guests to record each dive, regardless of what was seen.
Before each dive, dive guides instructed guests about the marine region, the objectives of the GFSC, and presented a field guide to correctly identify the sharks they can potentially encounter in Fiji.
At the end of each dive, everyone logged their dive – including site name, date, bottom time, depth, feeding/provisioning, and spearfishing. Divers also logged their observations of sharks, including species, abundance, mating, and the presence of juveniles (possible nurseries sites). This included zeros – when no sharks were seen. To increase the value of the dataset, we also collected observations of rays, turtles, seahorses, whales, and dolphins (these data have not yet been analyzed).
At the end of each GFSC, which took place in April and November every year, the datasheets were mailed into headquarters for entry into spreadsheets, then we performed quality assurance and quality control (QA/QC).
One major issue was location. Site name was chosen as the location identifier because the community did not want to make coordinates available for fear of poaching. Site name, however, turned out to be particularly challenging because dive operators have different names, or spellings of names, for the same site. For example, “Christine’s Bommie” could also be called “The Bommie”, “Chris’ Bommie”, “Chrissy’s Bommie”, or “Bommie”. One site with many names. Or, there were multiple sites with the same name (e.g.,“The Aquarium”). This made it challenging to associate sightings from multiple operators to the same site. Rather than trying to conform the dive operators to use our site list, we instead had each operator create their own list and then we cross compared and worked back from there to create one main site list.
It was an extremely slow process, and we had to work through many issues, but we eventually got there.
Since there was so much data, the next challenge was figuring out what data, analysis, and results to show.
A “Magnum Opus of Citizen Science”
The commitment of the Fijian dive community to the project was outstanding. It took years of dedication for each of these dives to be accumulated and processed. This was long before the eOceans mobile app and analytics platform was built. Participants received very little feedback during the course of the project, but they stuck with it and created one of the largest, longitudinal surveys of sharks ever.
From 2011 to 2016, thirty-nine (39) dive operators from across Fiji conducted the Great Fiji Shark Count (GFSC).
They sampled 592 sites!
They recorded observations from 30,668 dives!
They recorded 146,304 shark observations!
Together, they recorded the distribution and relative abundance of 11 shark species, including two Critically Endangered species (Scalloped and Great Hammerhead), three Endangered species (Grey Reef, Sicklefin Lemon, Zebra Shark), and five Vulnerable species.
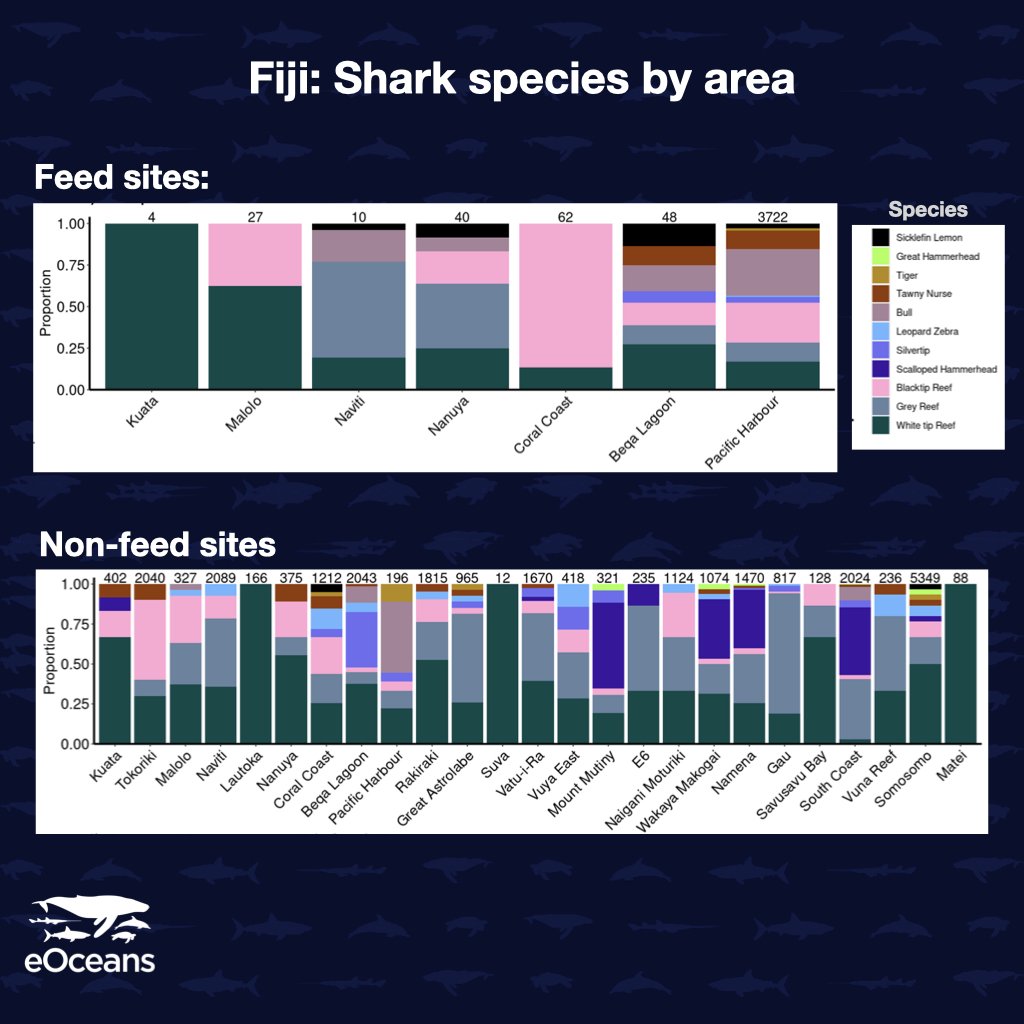
The diversity (species richness) and abundance differed by area. Feeding also impacted shark species richness and abundance. Some species were never observed on a feed dive (e.g., leopard/zebra, scalloped hammerhead and great hammerhead sharks), others were more common on feed dives (e.g., bull, blacktip reef sharks). Whitetip reef sharks were ubiquitously common across areas and sites. Figures: Ward-Paige et al. 2022
We found that sharks are observed on 45% of dives (13,846 dives) at 74% of the sites (441 sites). ** Note the importance of zeros here! We couldn’t state these percentages if we didn’t collect zeros.
We found that sharks varied by site, area, season, and year in terms of their presence or absence, diversity (richness), and relative abundance.
Generally, our results matched those from other, more limited surveys, including from
baited-remote-underwater-video (BRUVs). Both reviewers thought this was interesting since a lot of effort has focused on BRUVs for sampling sharks.
We also found that there were more sharks per dive in April than November.
Seasonal variations, including species with relatively small home ranges, are interesting from a science perspective since scientists typically have “field seasons” and only sample a small time window. With only 45% of dives having observed sharks, there is a good chance scientists would get biased or inaccurate results.
These trends could also be quite interesting and important for tourism. Trends could potentially be used to prioritize tourism opportunities to, for example, increase chances of diving with sharks, working through a diver’s bucket list, and to optimizing socio-economic values.
Trends through time.
Four years isn’t really a long enough time, typically, to document trends in species that have slow life history characteristics. So, we didn’t expect to find trends.
Although that was generally true, we did find a few patterns.
One exception was particularly surprising.

Whitetip Reef Sharks, the most commonly encountered shark species, significantly increased at nearly all western sites (blue dots) and decreased on eastern sites (red dots). We don’t yet have a reasonable explanation for these trends. Photo Credit: Amanda Cotton / Ocean Image Bank, Map Credit: Ward-Paige et al. 2022.
Over this relatively short period of time (4 years), the most commonly encountered species, Whitetip Reef Shark (Triaenodon obesus), significantly increased at nearly all western sites and significantly decreased on all eastern sites. (See map inset – blue dots are significant increases and red dots are significant decreases.
These trends cannot be explained by systematic sampling changes, such as divers getting better/worse at finding Whitetip Reef Sharks because it would have had to happen at each site, with opposite effects at every site on the west and east. There is no evidence for this.
This species does move tens of kilometers, but it is unlikely to have moved the hundreds of kilometers needed to depopulate the eastern sites and repopulate the western sites.
It’s very curious.
What could explain these trends?
We don’t know, but hope these results spark further discussion and investigation.
Relevance to sharks in Fiji and beyond.
Generally, this study highlights the capacity of stakeholders to document their ocean and the importance of supporting broadscale, longitudinal, participatory science methodologies that unite communities to track the dimensions of the ocean they value.
Blacktip Reef Shark (Carcharhinus melanopterus) – one of the three most commonly sighted sharks – in Fiji. Photo: Tom Vierus / Ocean Image Bank
This study should prompt future scientific research efforts in Fiji and beyond.
For example:
In Fiji, to guide future scientific questions about sharks, such as “What is driving the changes in Whitetip Reef Sharks across the country?”, “What are the threats to the hotspots of sharks?”, and “How are shark populations changing in response to protection, fishing, or tourism?”.
To move beyond sharks and Fiji, using the same methodologies to study sharks all year and throughout the Pacific or global ocean, expanding to other species (e.g., turtles, whales) and their threats (e.g., plastics, ghost gear).
To build understanding of the socioeconomic value of tourism through space and time, and to understand the influence of particular species, threats, policy successes, or conservation that drive socioeconomic value?
To guide marine spatial planning and the design of marine protected area networks, especially for rare and mobile species and tourism.
Scaling these methodologies: For any location, species, or interest group.
Importantly, the size and scale of this project illustrates the value of pursuing scientific projects that work for and with stakeholders and rightsholders.
The eOceans mobile app and platform automates the expertise of scientists to enable all ocean explorers to log what they see — any species or issue, anywhere in the world — and to automatically share and analyze those data in real-time to help make informed decisions. Photo: eOceans
At eOceans, we aim to listen carefully, to be empathetic to local perspectives, and to help ask and answer questions that matter.
The GFSC was one such project.
But it was all manual – pencil on paper with manual entry and analysis – the same way marine research has been conducted since the 1950’s.
Just like eShark, eManta, the Global Shark Sanctuary Assessment, it was too expensive, time consuming, and slow to help with urgent conservation needs. Sharks, fisheries, plastic pollution, climate change, marine protected areas, invasive species, etc. are all changing fast, and doing manual science holds back discoveries and inhibits the possibility of timely actions.
We urgently needed automation.
Using the lessons learned through the GFSC, and other similar projects, eOceans spent the last 4 years building a mobile app and analytics platform to automate the GFSC – making it more accessible, affordable, engaging, empowering, and with quality checks and analysis performed in real-time, it allows for faster, dynamic, informed decision making.
eOceans app and platform works for tracking of all marine species (>200,000 species listed), and issues (e.g., pollution, spills, entanglements, diseases) from any activity, anywhere in the ocean.
Future Great Fiji Shark Counts can, and should be done in real-time.
Studying urgent ocean matters?
If your organization or community needs to track an ocean related issue anywhere in the world you can get your own project started and powered by eOceans at eOceans.app.
We’re on a mission to help communities, businesses, and organizations around the world get the scientific support they need to track and protect their ocean, livelihoods, and way of life on time-scales that keep pace with change.
For the ocean. For us.