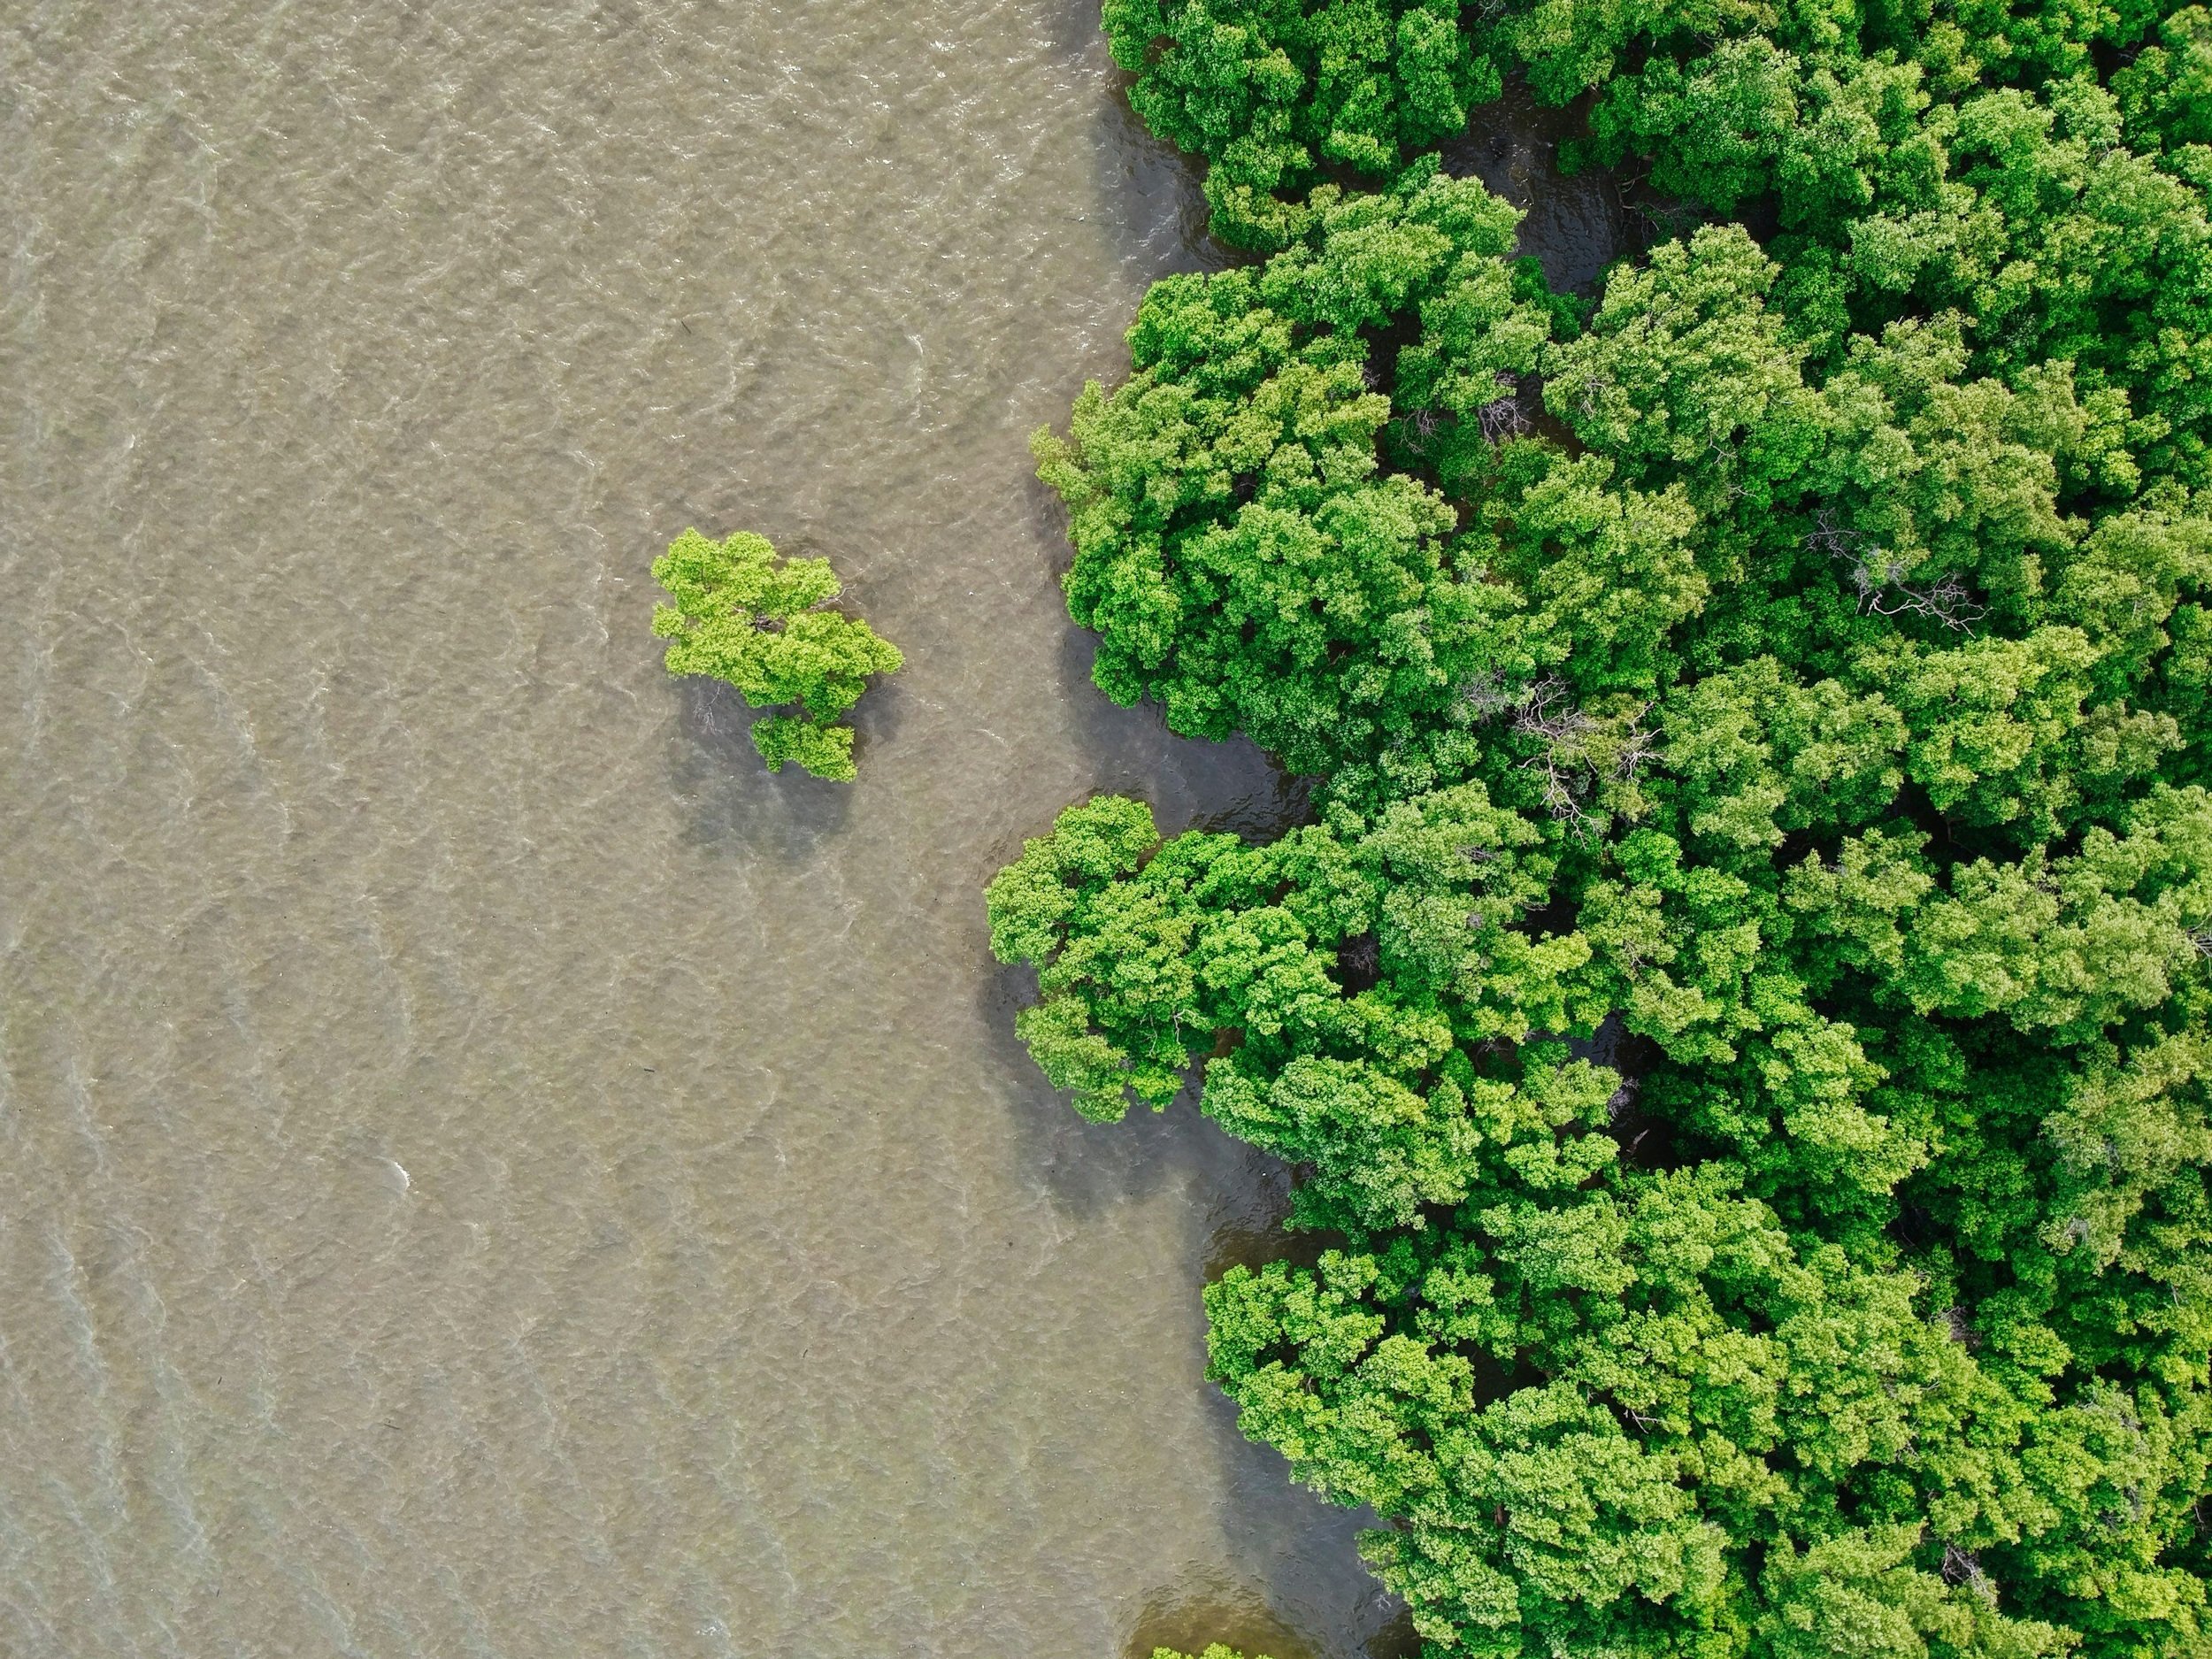
Help your community thrive.
Turn observations into results, to defend what matters.

Built for speed. Built for trust. Built for impact. Proudly Canadian.
Make your community science matter
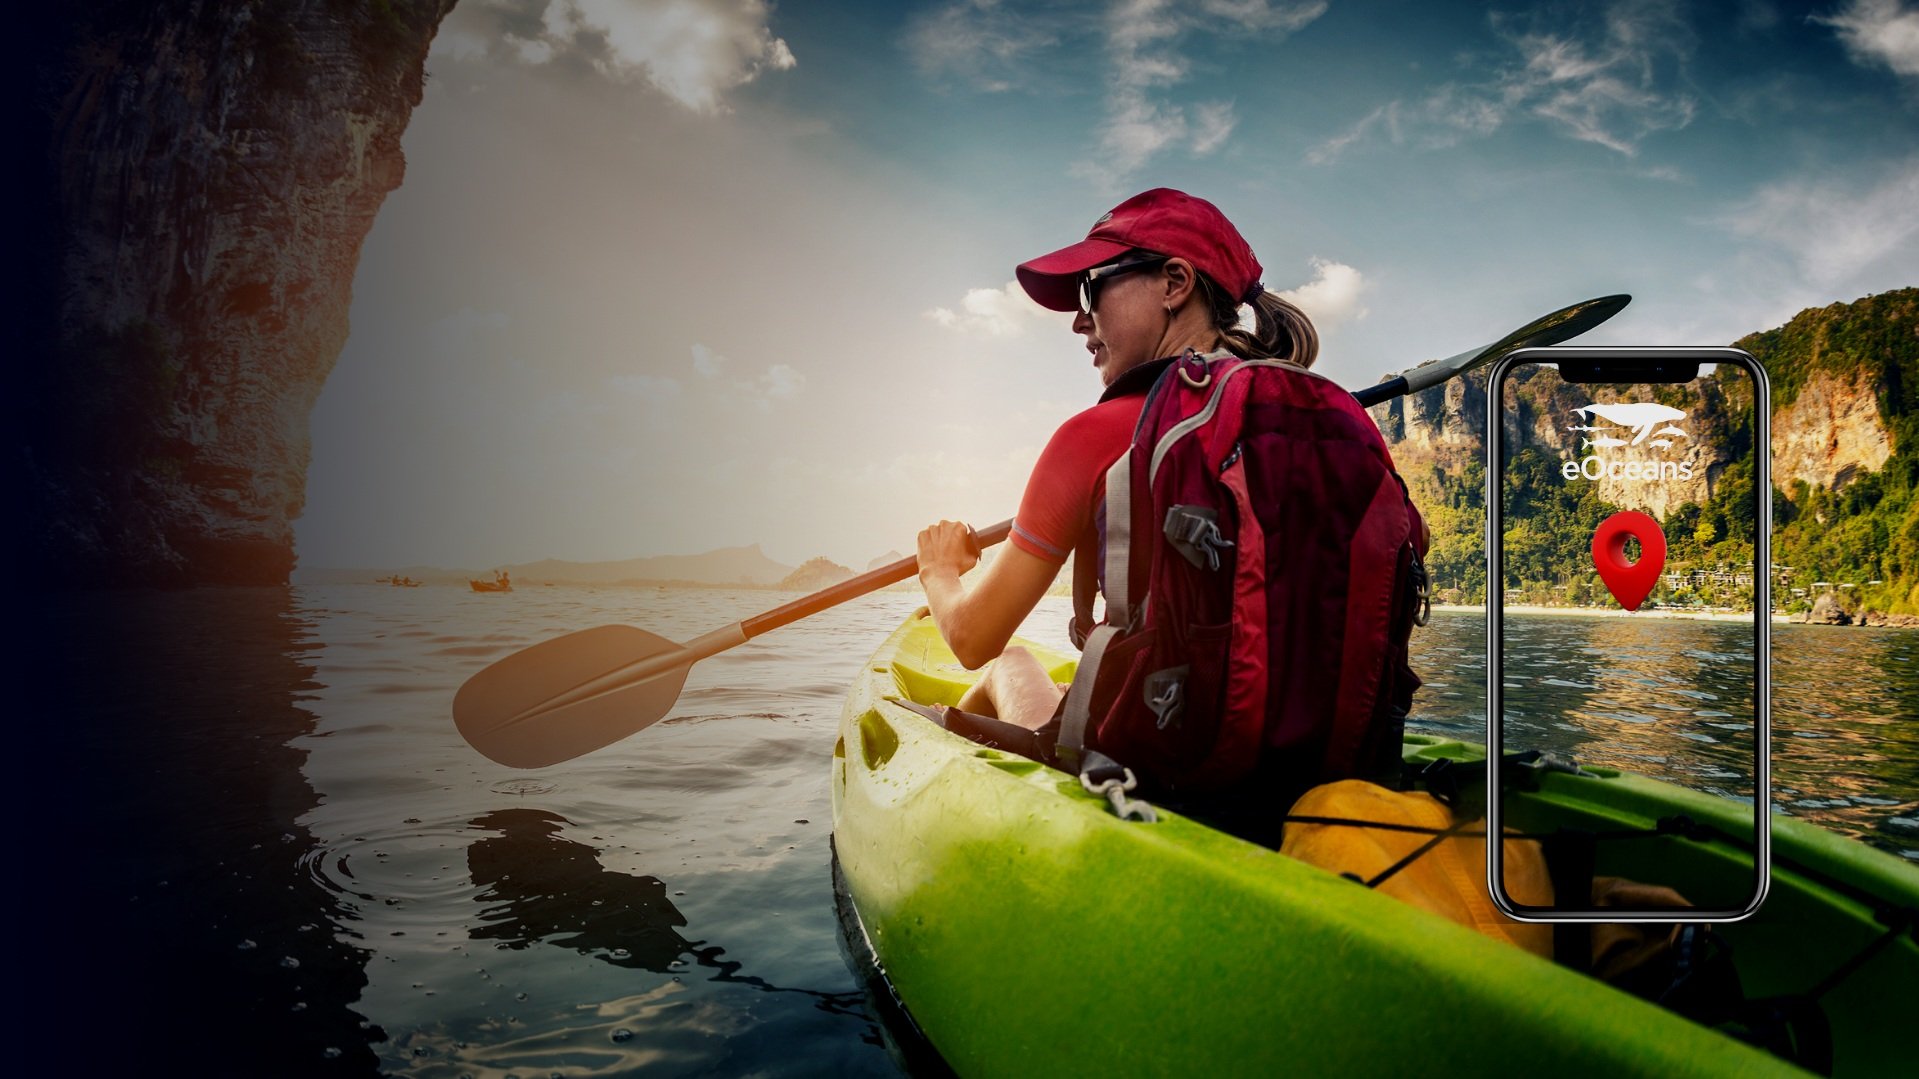
We get it—your special place is under threat from poor decisions. You’re waiting for science and policy that make sense, but they’re taking too long. It’s up to you and your community. With eOceans, the wait is over. Turn your observations into insights and take action now.
The one platform purpose-built for your success.
Track anything through space and time. Get insights locally or globally. Collaborate with anyone. Influence policy and decision making.

80% time saved. 100% mission focused.

Your mission is our mission.
We help you get there faster, easier, and smarter.
Meet eOceans.
“I set out to build a better knowledge flow system—something I needed as a scientist. Today, it’s an app and platform anyone can use to build faster, smarter projects in our fast-changing, complex world.”
Dr. Christine Ward-Paige, CEO eOceans
