Build ambitious research projects.
Make breakthroughs that amplify your work, attract strategic partnerships, and secure support for meaningful change.

Built for speed. Built for trust. Built for impact. Proudly Canadian.
We’ve been where you are—driven by impact but held back by outdated tools, tedious tasks, and slow workflows. In a competitive, fast-changing world, you need tools that move your career and impact forward.
The one platform purpose-built for your success.
Track anything through space and time. Get insights locally or globally. Collaborate with anyone. Influence policy and decision making.

80% time saved. 100% mission focused.
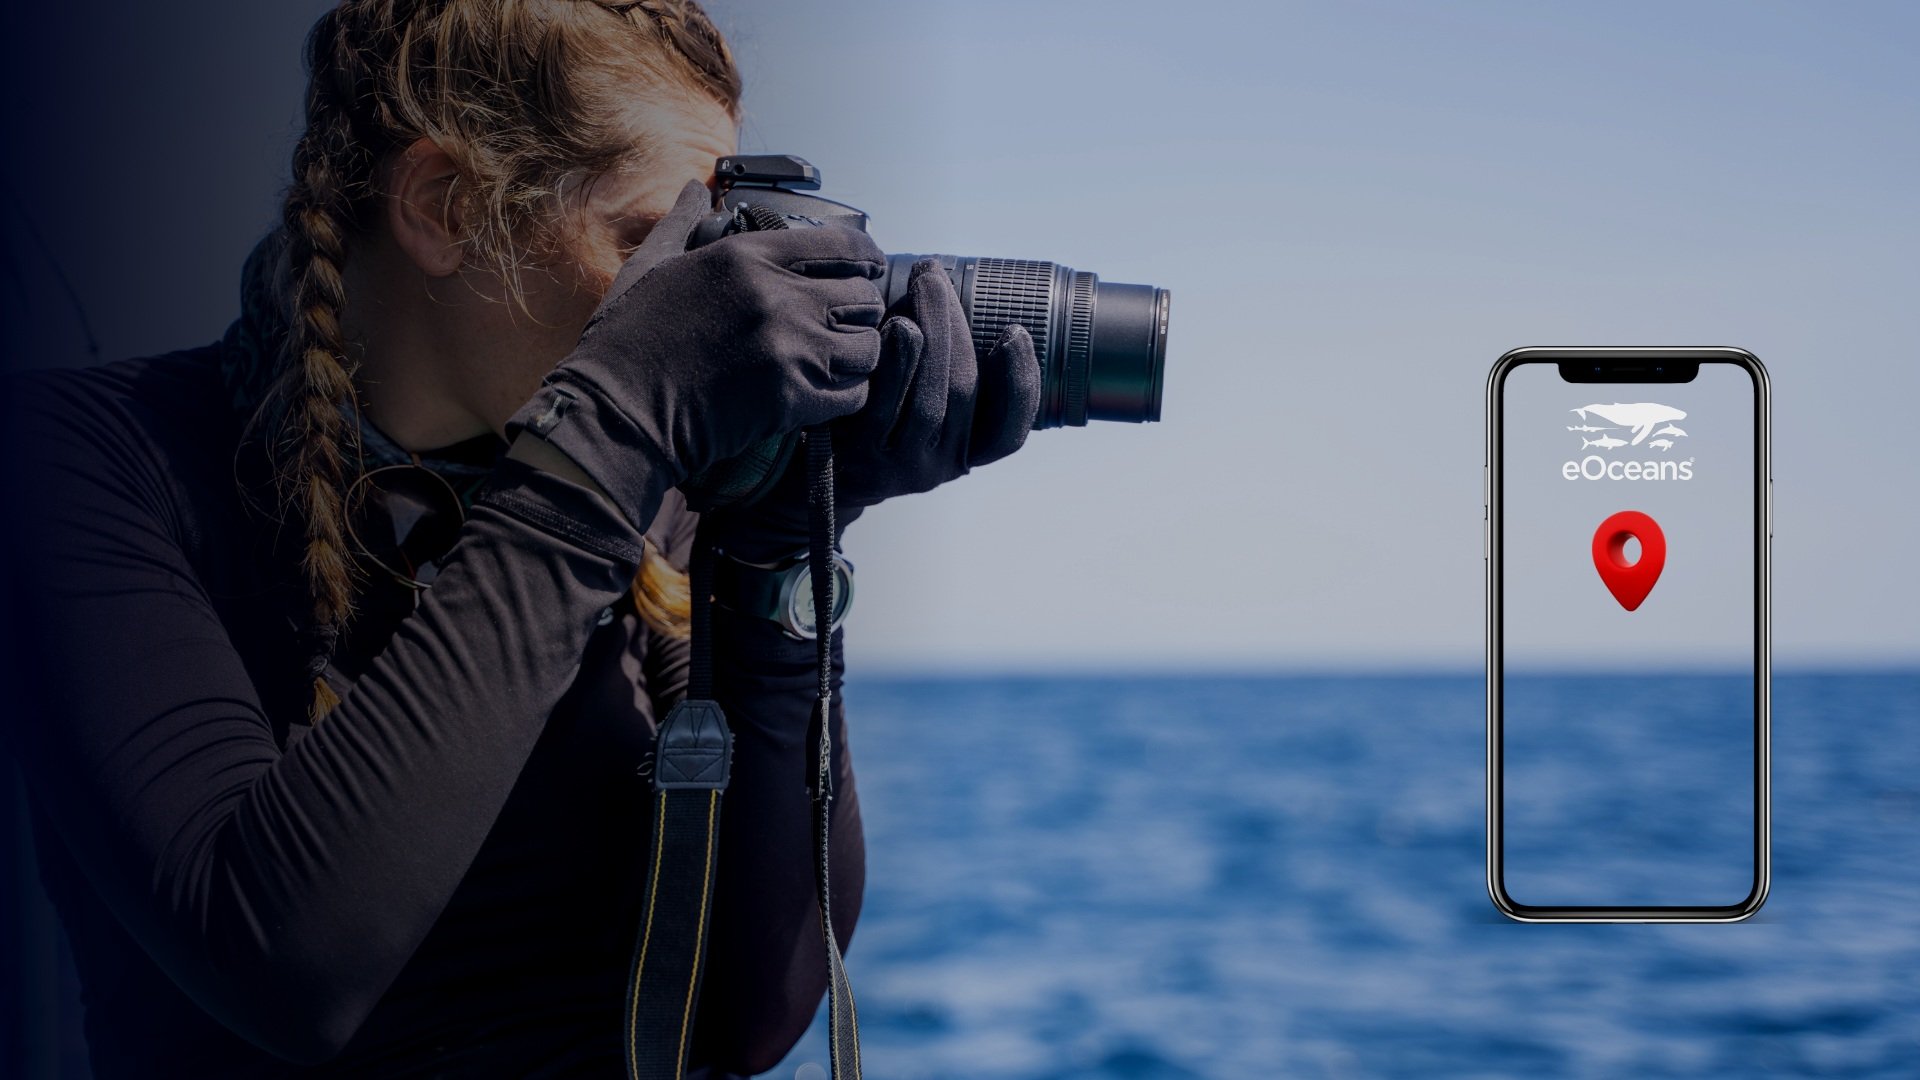
The app you’ve been dreaming of.
Designed and built by PhD scientists, eOceans removes the bottlenecks that slow you down — so you can focus on solutions.
Empower your project with cutting-edge data science and actionable insights to move faster and make a measurable impact.


Your mission is our mission.
We help you get there faster, easier, and smarter.
Meet eOceans.
Success stories:
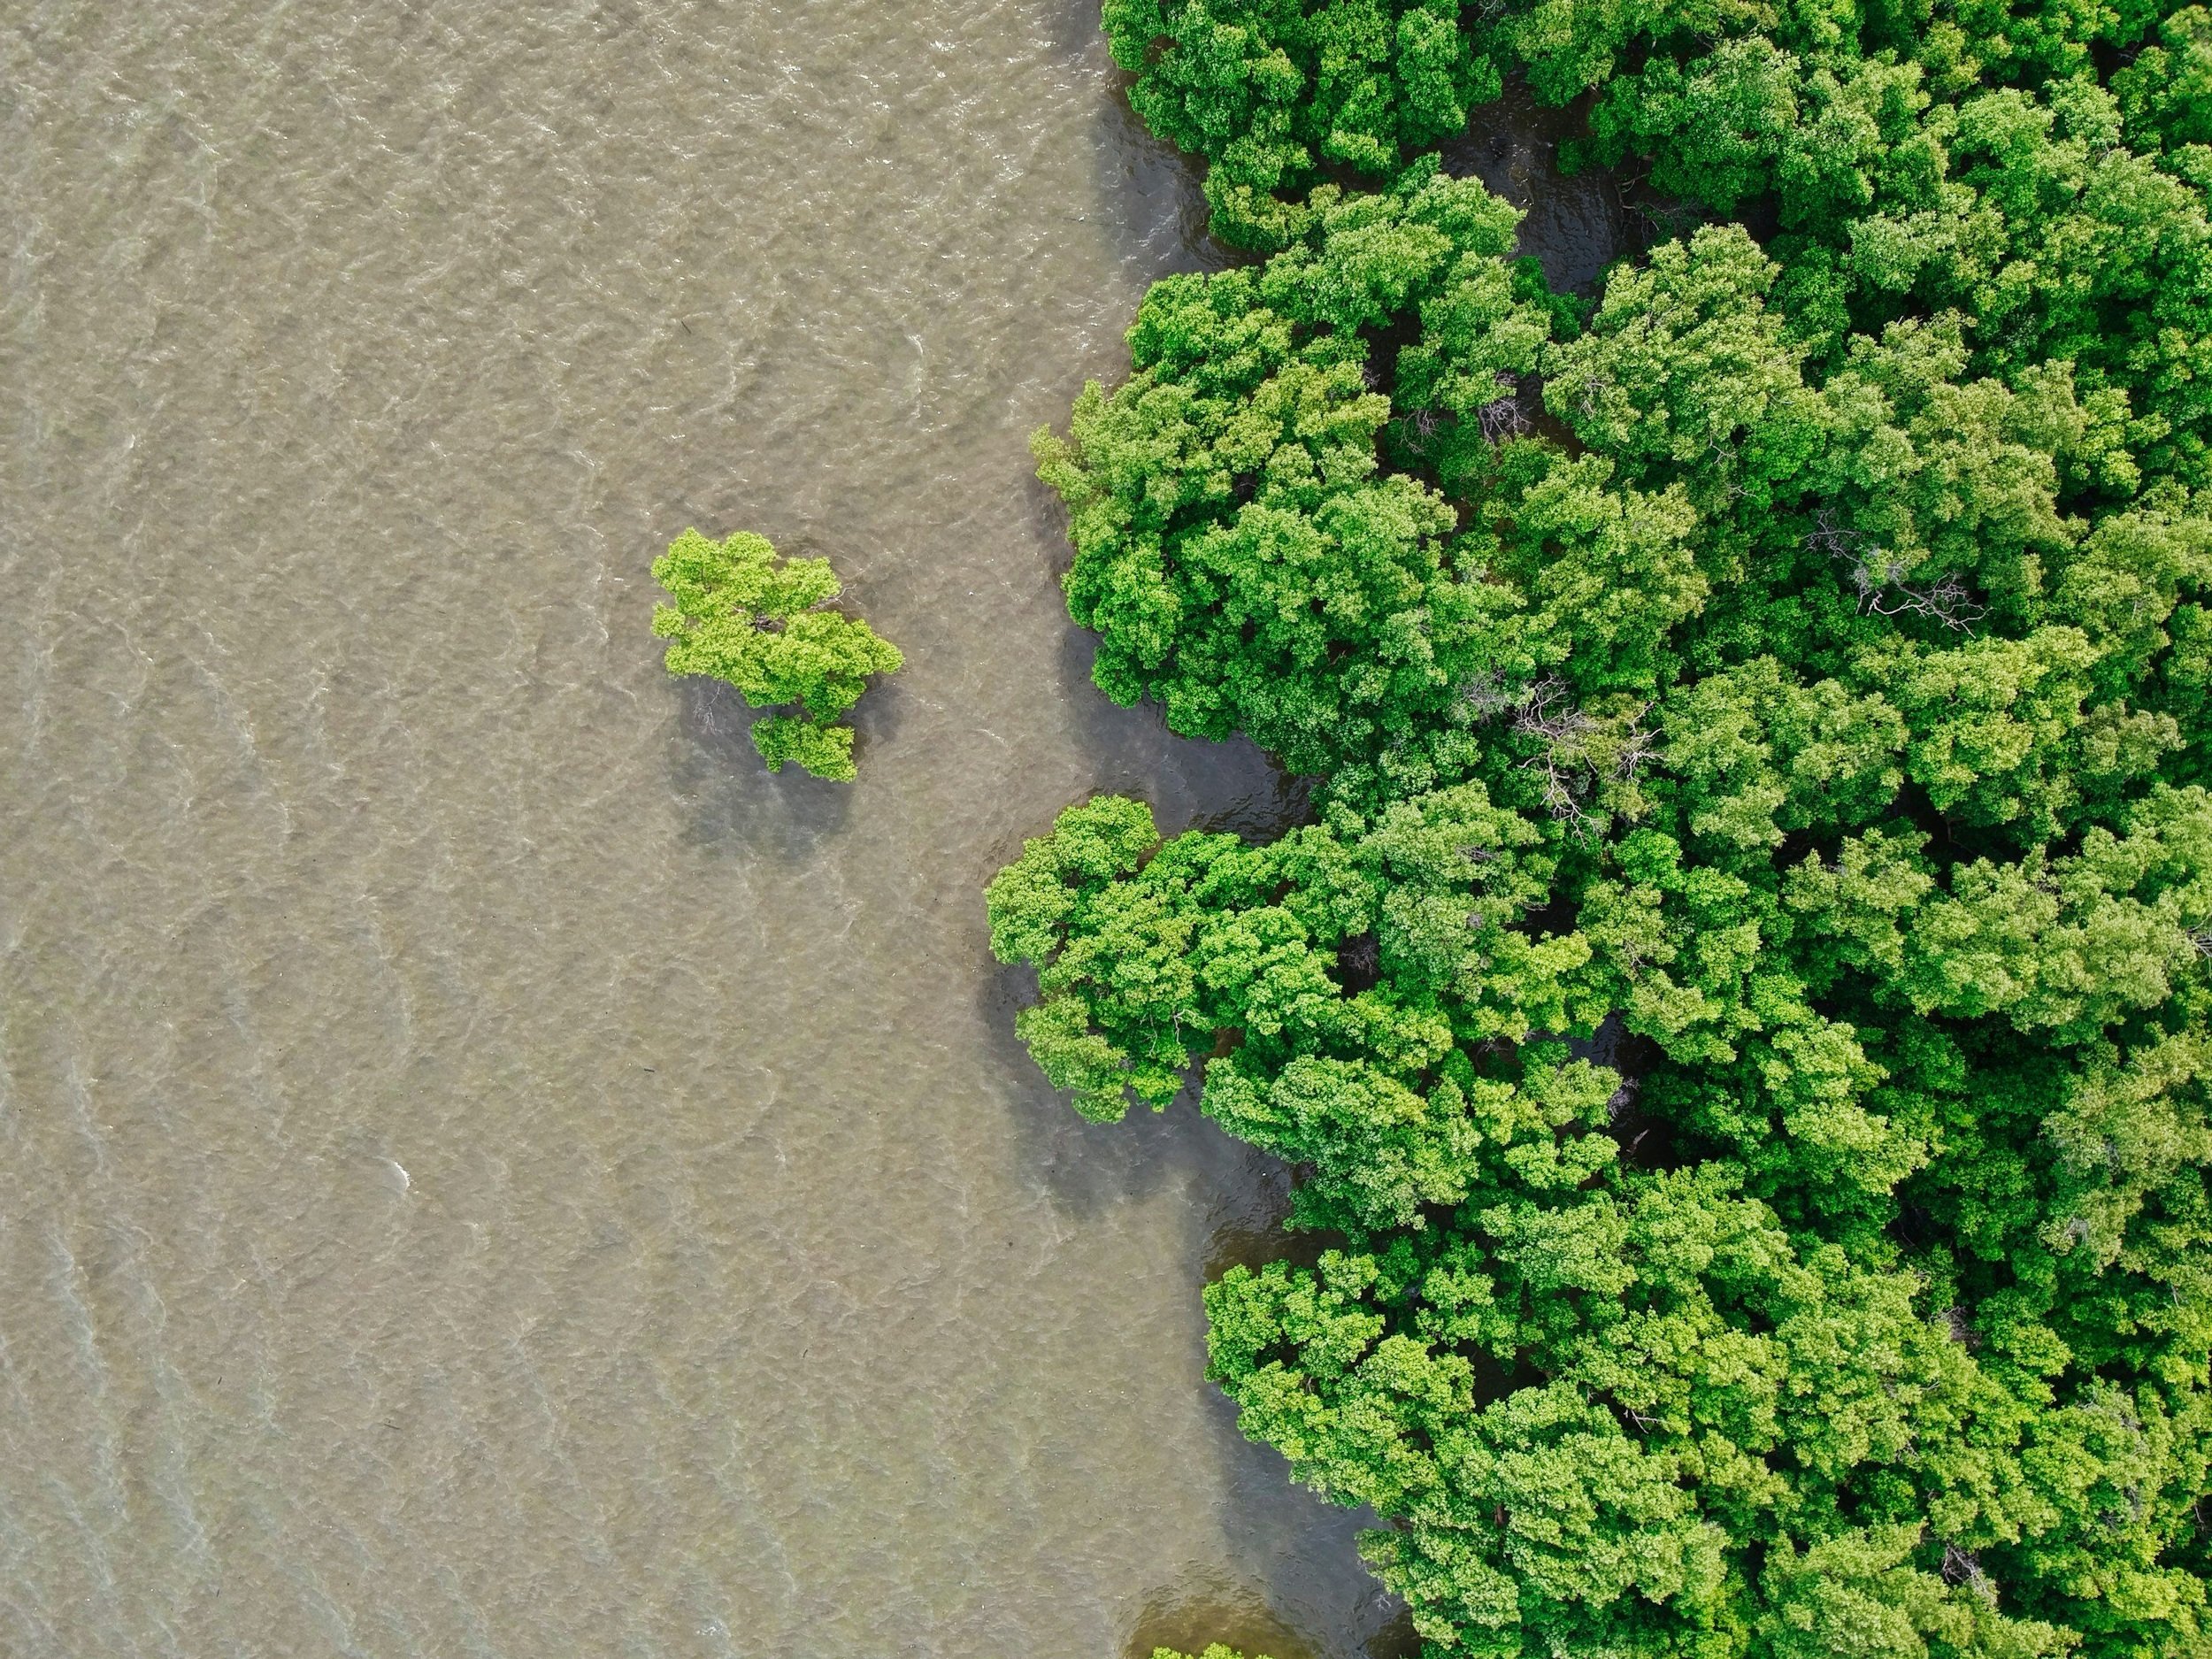
California deploys eOceans to collaboratively track the health and value of Marine Protected Areas.

SlingShot™ awardee protecting migrating whales from shipping industry in South Africa.
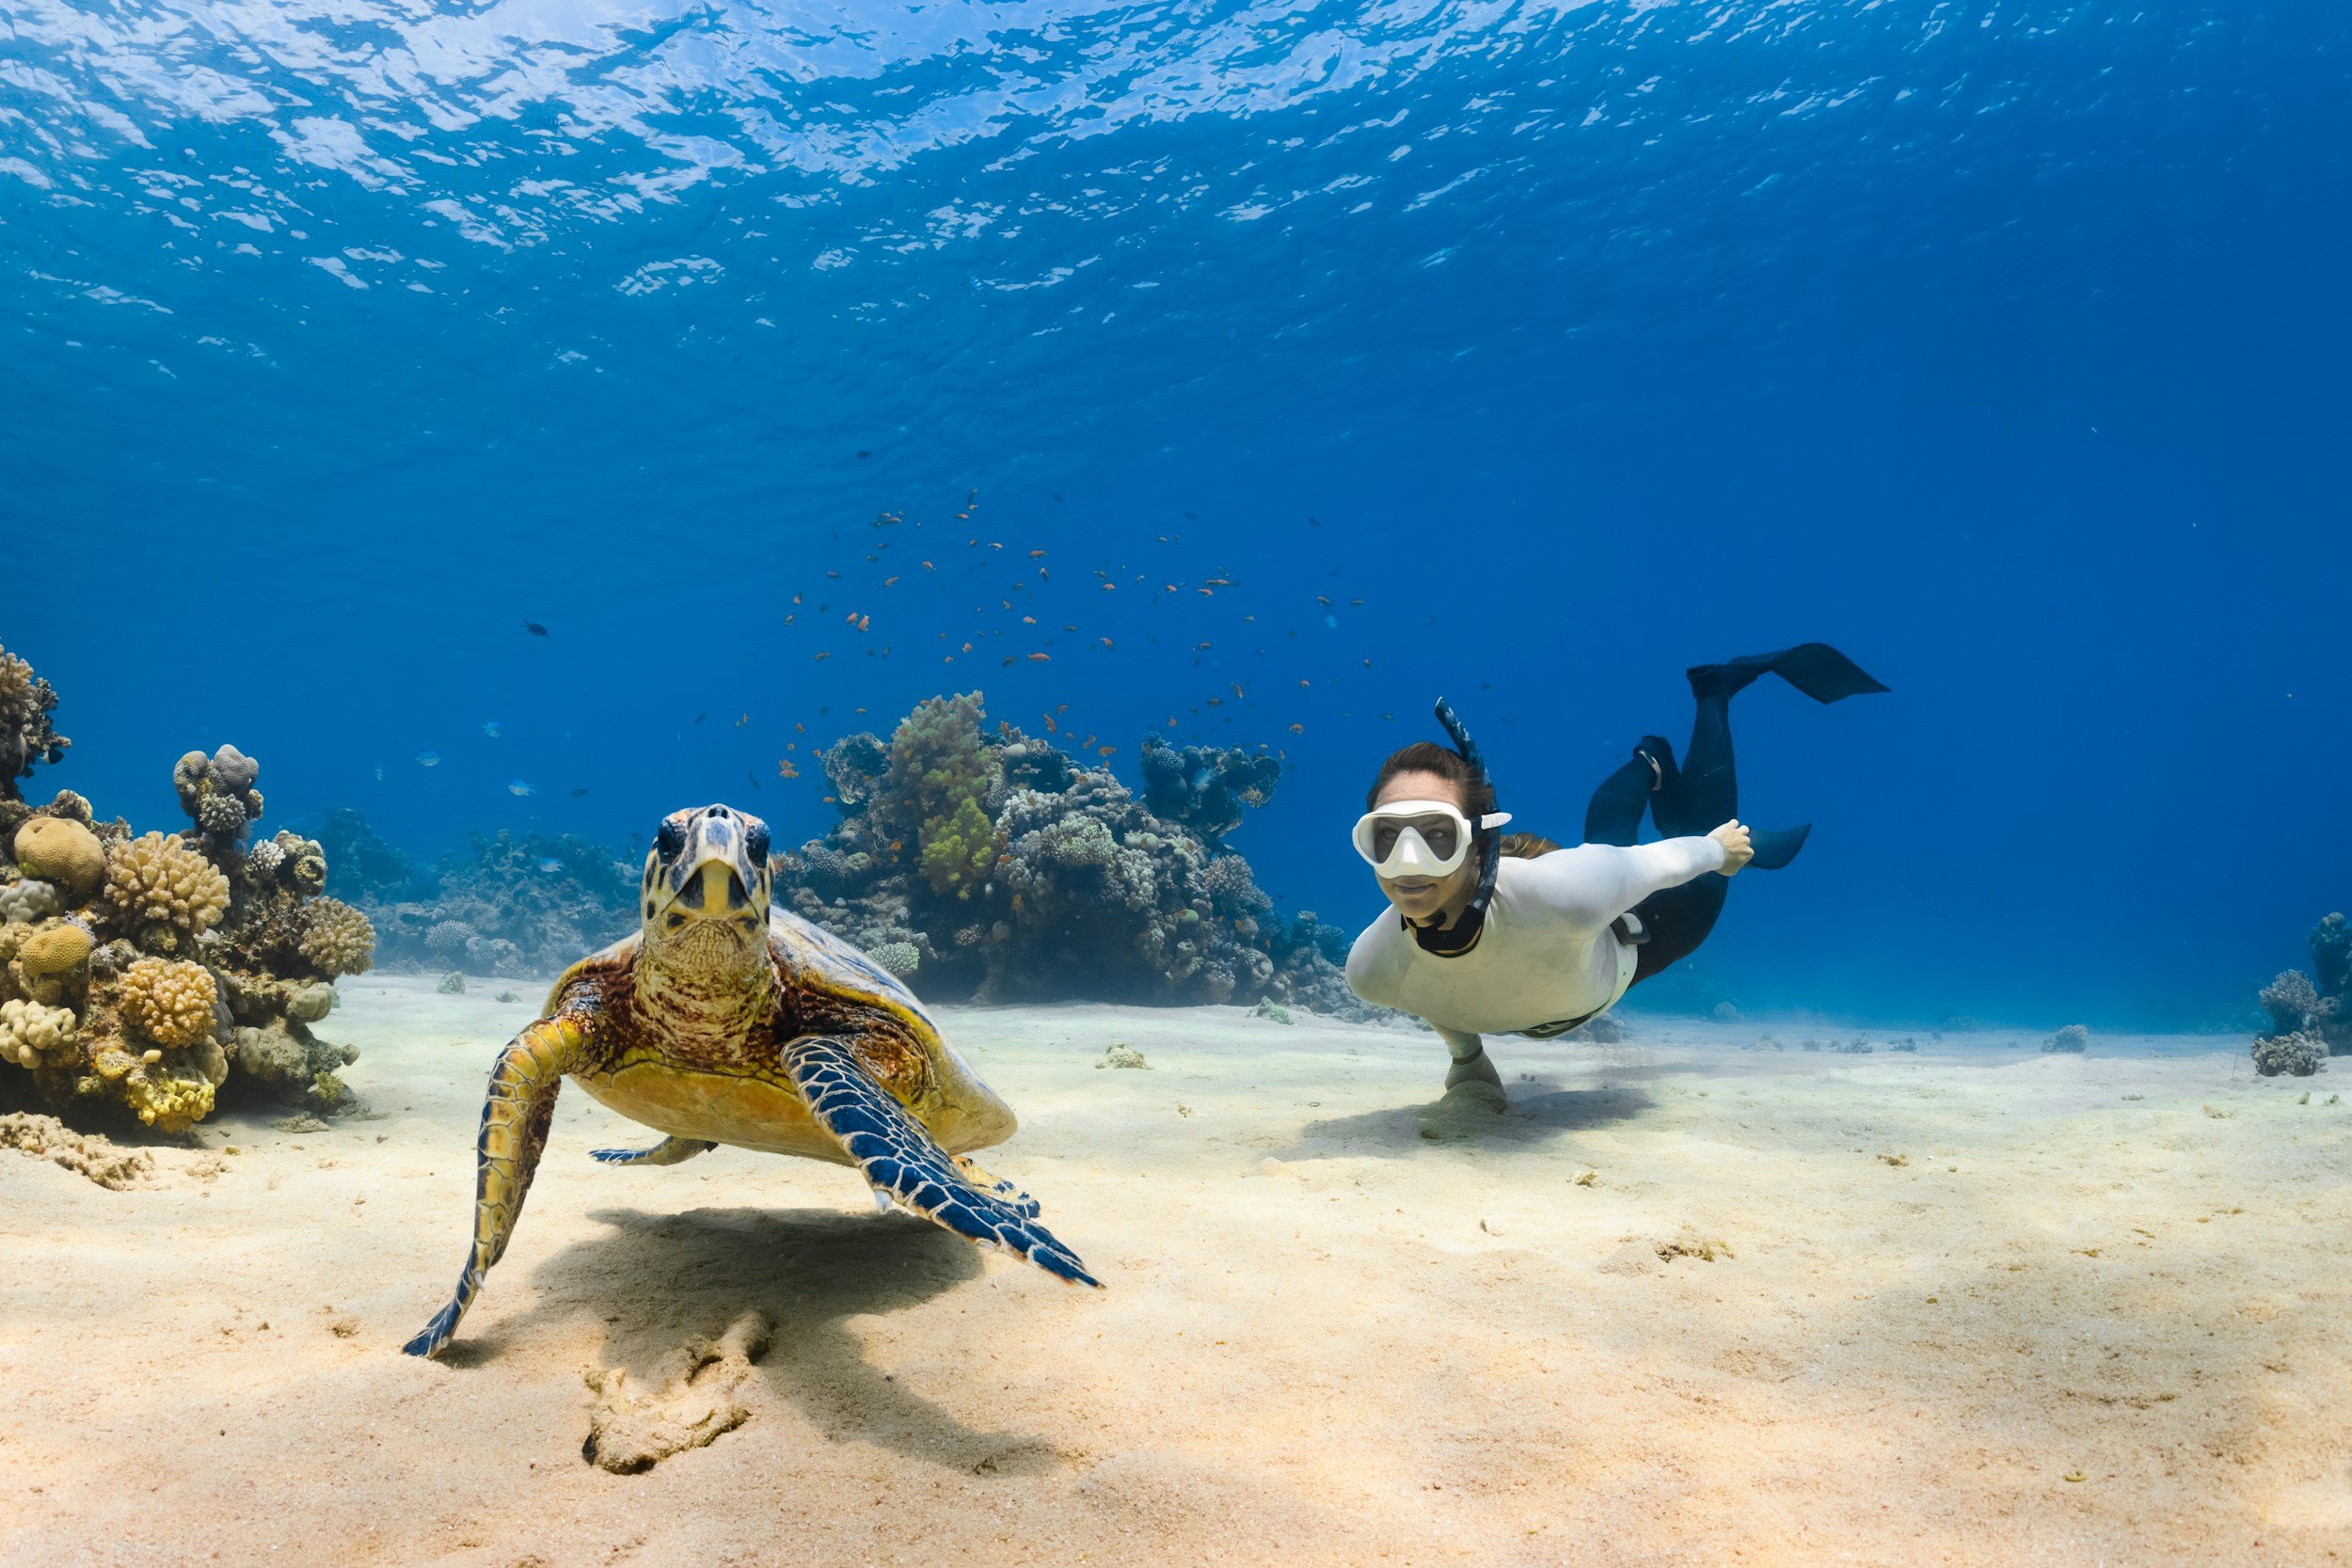
Wildlife is the main attraction for dive operators—this team is making sure it stays that way by deploying eOceans to track megafauna and to designate the right MPAs.


“This is what we’ve been dreaming of.”
Fishery biologist
“eOceans offers invaluable tools for seamless data collection-to-analysis, enabling unprecedented collaboration and insights.”
Liz Ferguson, CEO, Ocean Science Analytics
“eOceans empowers us to optimize our data collection by engaging dive centres, resorts, and local communities. By maximizing our field time, we can focus on gathering insights while eOceans seamlessly manages the data processing and analysis.”
Jess Hodge, Marine Biologist, Maldives Underwater Initiative at Six Senses

“I set out to build a better knowledge flow system—something I needed as a scientist. Today, it’s an app and platform anyone can use to build faster, smarter projects in our fast-changing, complex world.”
Dr. Christine Ward-Paige, CEO eOceans
