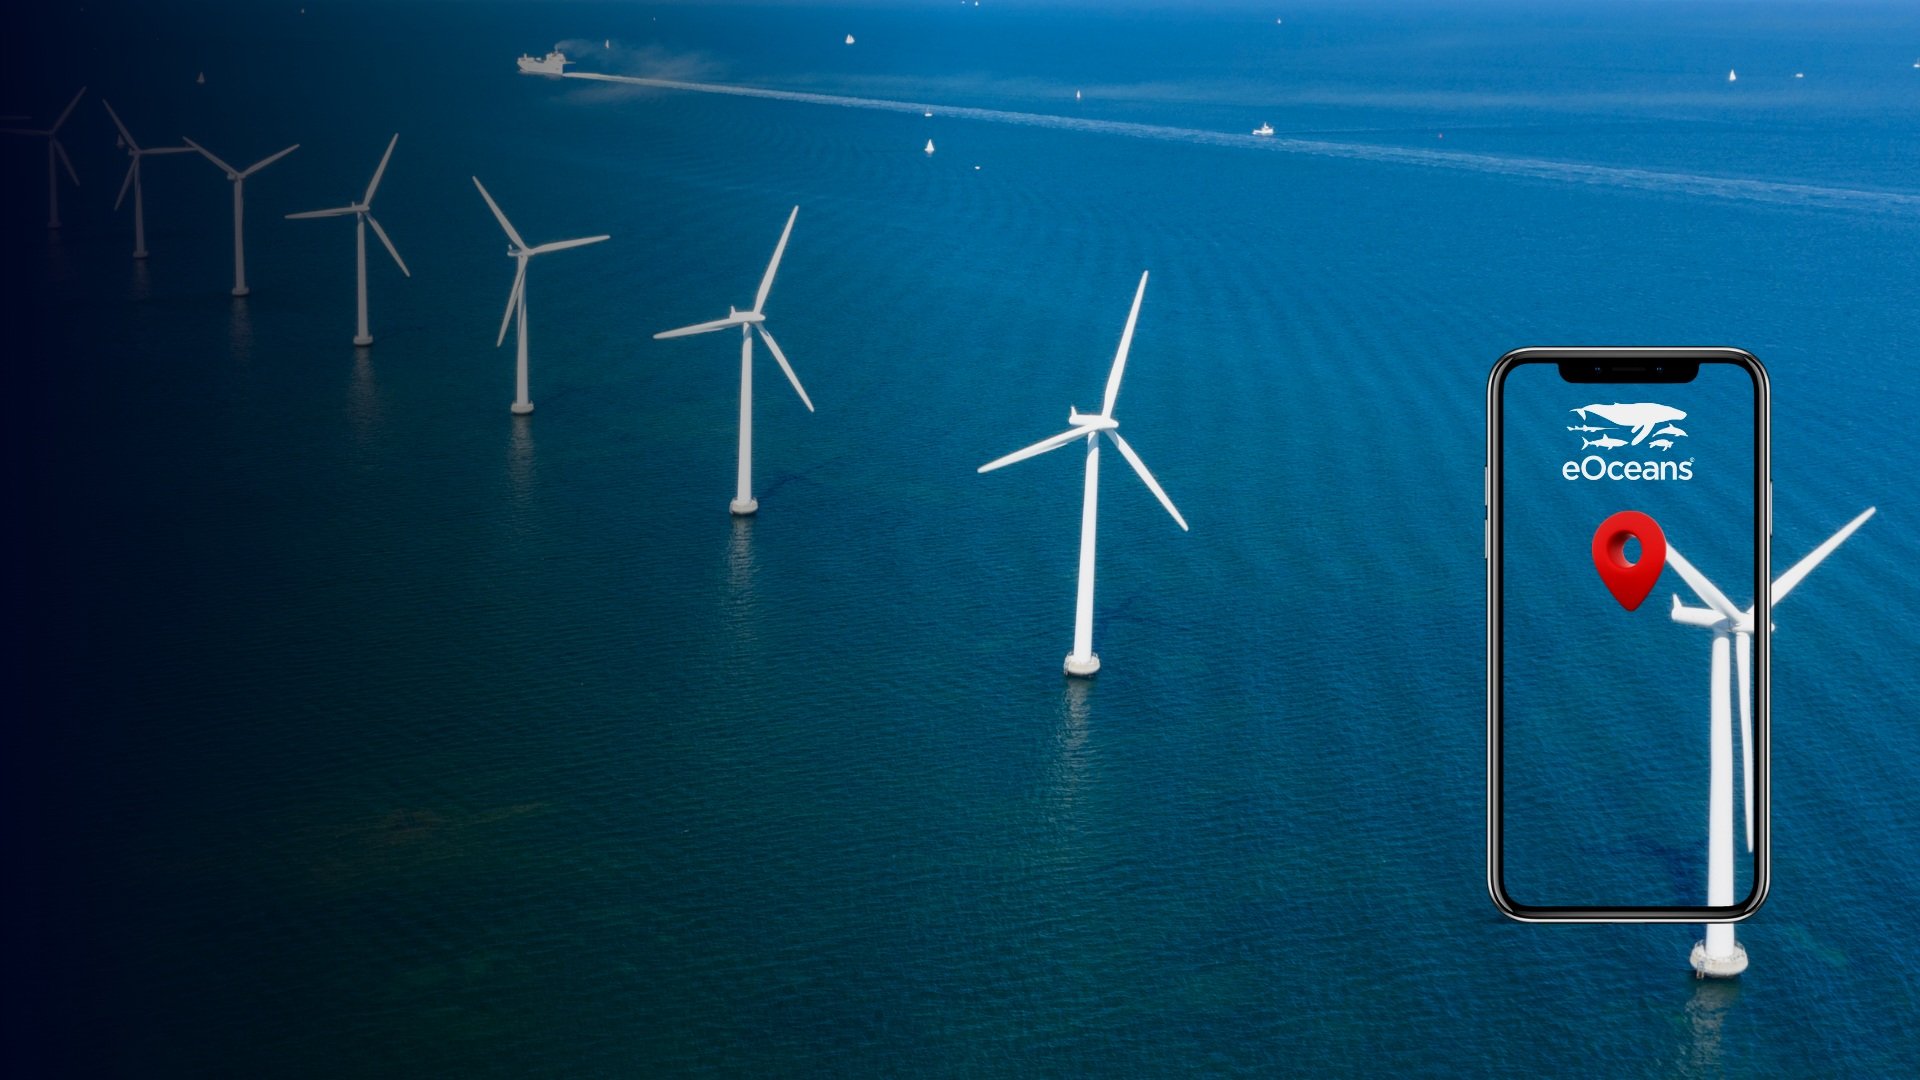
Faster, better monitoring & engagement for Offshore Wind.
eOceans delivers real-time data, seamless collaboration, and automated reporting—ensuring efficient, science-driven decisions for smart offshore wind development.
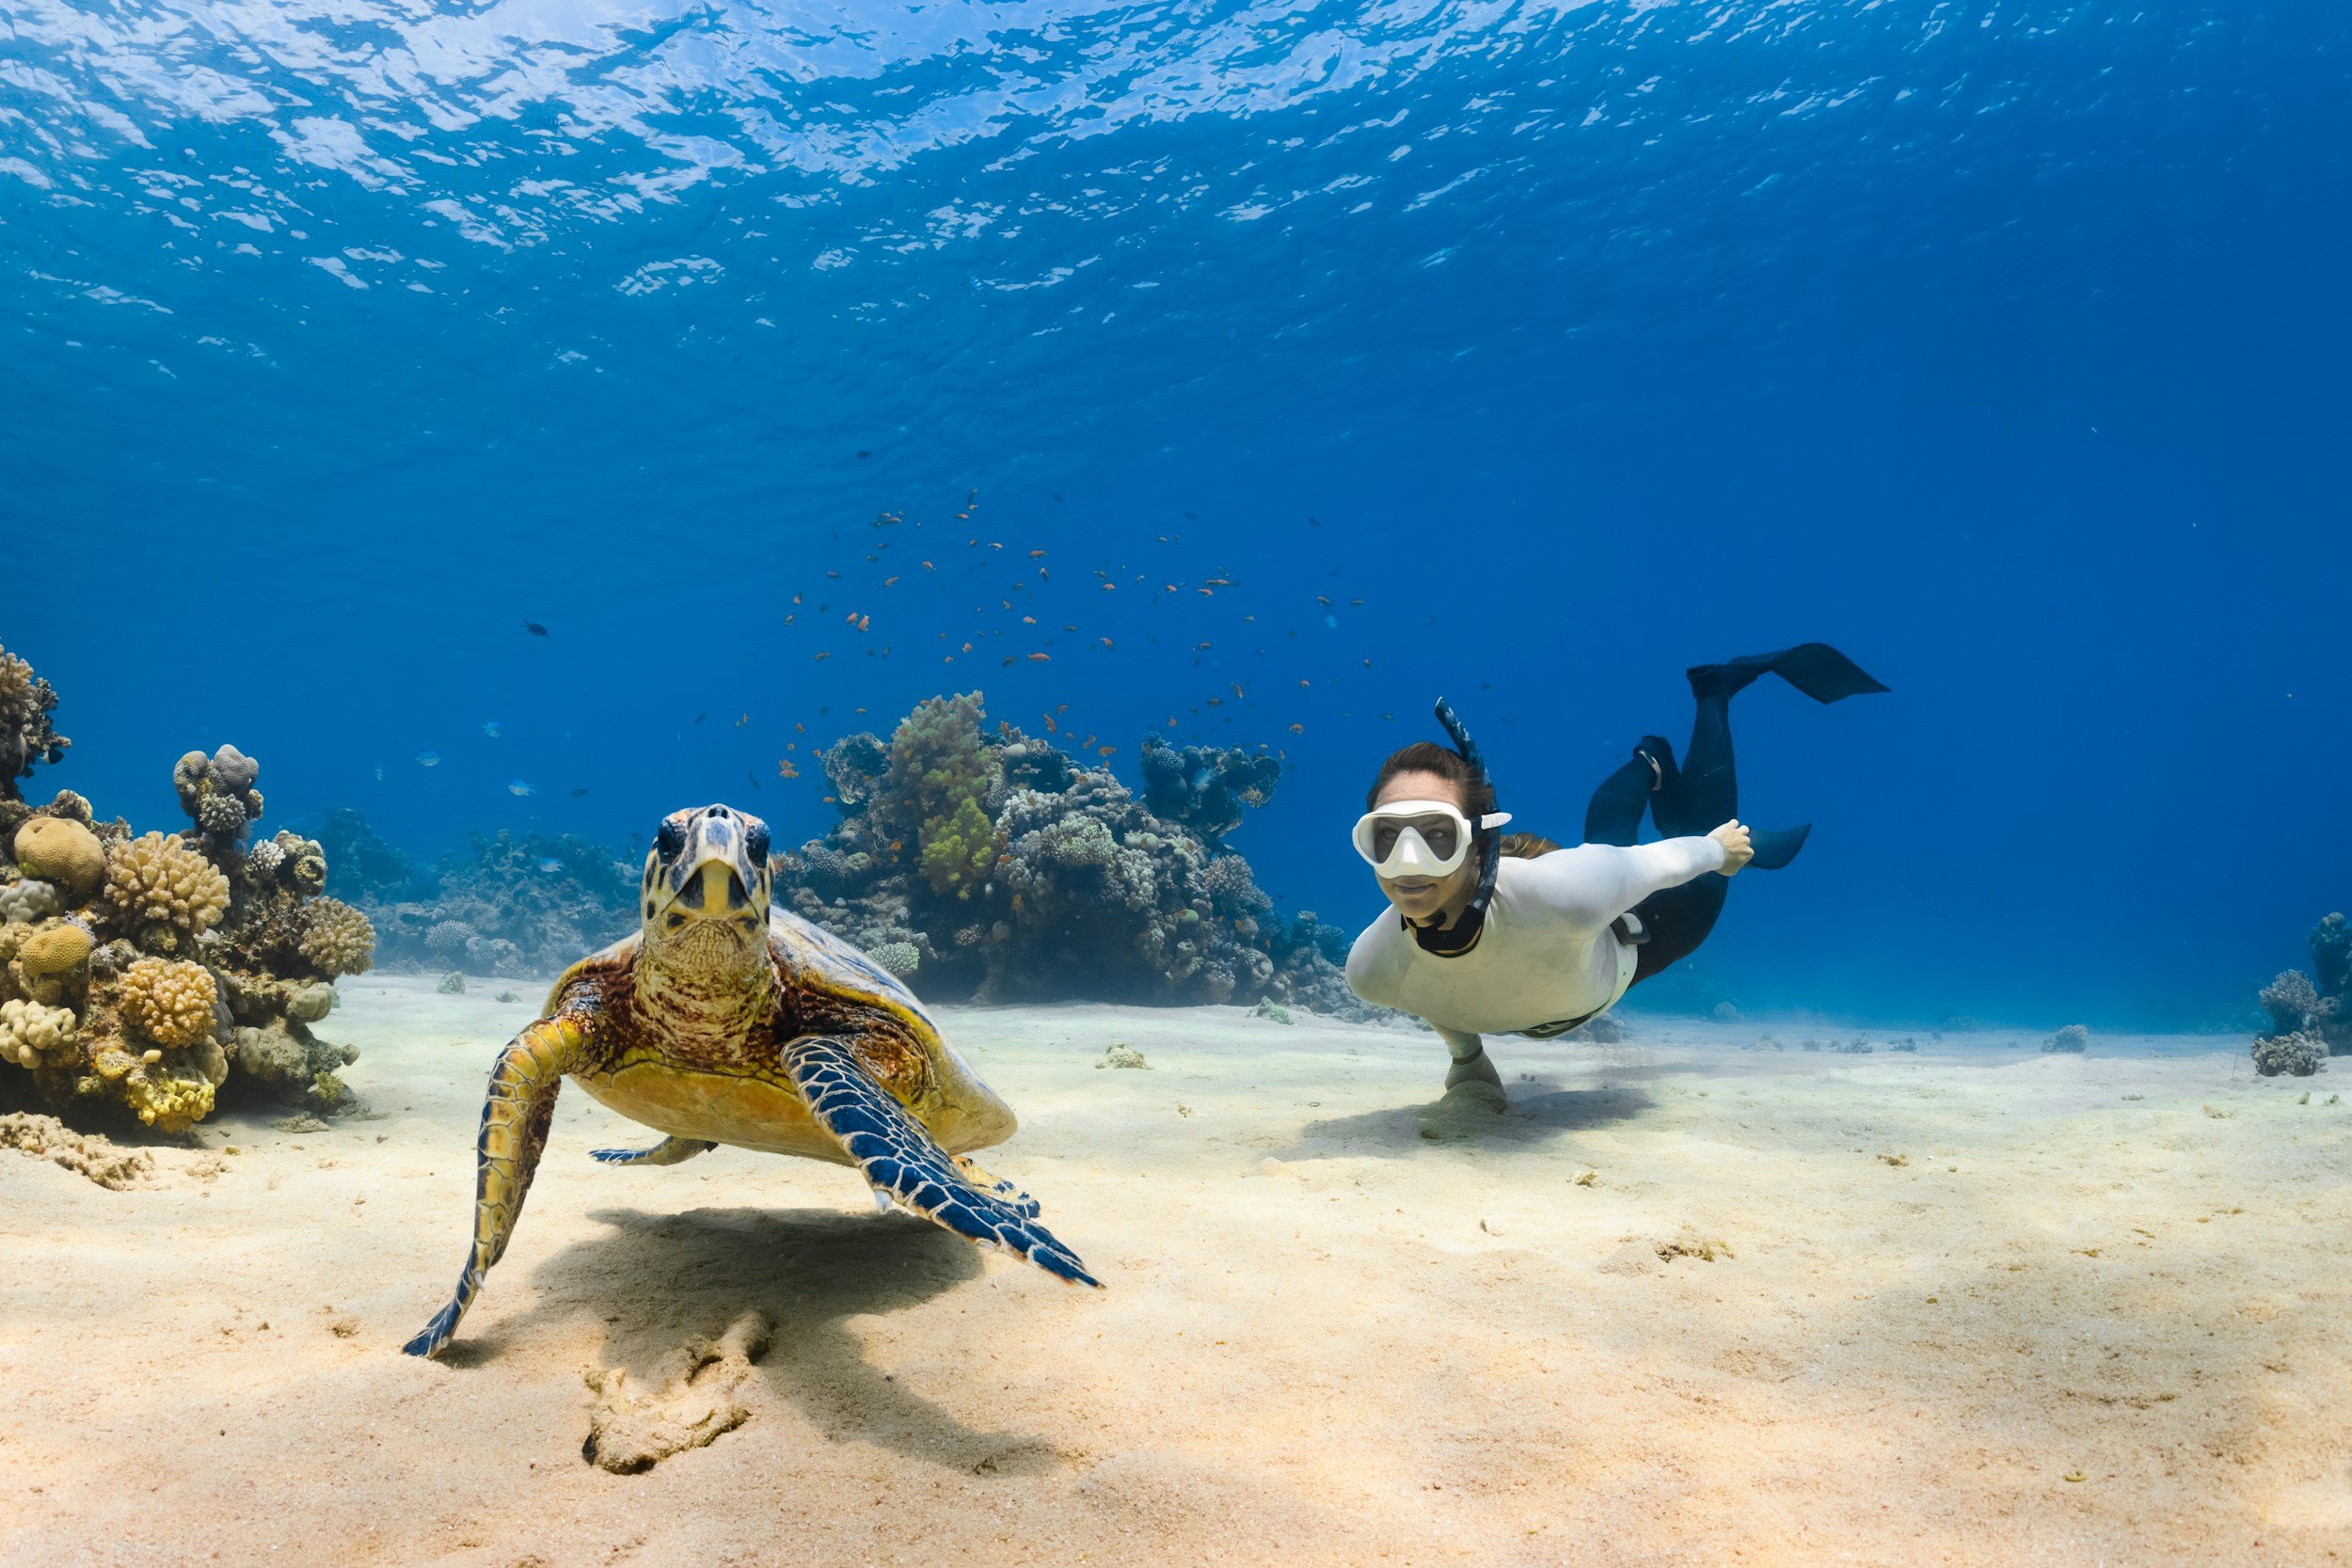
Explainer | Book Demo | Spec sheet

Offshore wind projects are being deployed, but they must be developed responsibly to protect marine ecosystems and the people who depend on them. Traditional environmental assessments are slow, outdated, and create mistrust—holding back smart projects.
eOceans delivers real-time monitoring, impact assessment, and stakeholder engagement—ensuring faster, data-driven decisions for responsible offshore wind development.
Helping you:
-
Streamlining your workflow—from data collection to reporting and dissemination—so you get the results you need fast.
-
Every observation is a piece of the puzzle that describes what’s happening in that location at that time. eOceans stitches them together to tell meaningful stories.
-
By helping organizations, researchers, and others avoid reinventing the wheel—analyzing data for just one question at a time—we enable them to use data for multiple purposes, keeping everyone focused on what truly matters.
-
Unlock the full potential of our planet—by protecting and restoring ecosystems, we can double Earth’s $150 trillion in natural assets, securing a thriving future for all.
-
A thriving ocean fuels prosperity—when biodiversity flourishes, coastal communities thrive, and social equity strengthens. eOceans empowers you with real-time insights to balance biodiversity with development for a resilient future.
The app you’ve been dreaming of.
Designed by PhD scientists, eOceans removes the bottlenecks that slow you down — so your team can focus on solutions.
Empower your project with cutting-edge data science and actionable insights to move faster and make a measurable impact.

Save 80% of your time and effort.
Your focus should be on impact—not tedious, expensive, error-prone, high-risk data tasks.
eOceans automates data management, analysis, and reporting, eliminating bottlenecks and saving you time. It’s like adding a million-dollar data science and PR team to your project—so you can focus on what truly matters.

Effortless metric tracking
Track your survey effort, metrics of success, biodiversity, social values, threats, and more through space and time.


Data to spreadsheets, visualizations, dissemination
eOceans streamlines parts or all of your workflow—from data collection, quality control, interoperability, sharing, analysis, reports, and dissemination. No more wasted hours on writing and entering data, quality checking, writing and debugging R code, pointing and clicking your way to making outdated maps or reports, or guessing what your impact is. With automated visualizations and flexible sharing options, your work stays relevant, visible, and actionable.
Adding data to all your projects is effortless.
eOceans automatically shares based on the location, sampling methodology, and variables added.


Built for teamwork
Invite your team—colleagues, students, scientists, rangers, guardians, fishers, observers, field staff, the public, and more—to contribute data to your project. As they do, the results come to life in your dashboard.
They can even help you co-interpret the results in the app.
Launch your project in under an hour
To get started, it’s as simple as filling out a form that defines your study area, variables, analyses, and data sources.


Our mission is your mission.
We help you get there faster, easier, and smarter.
Stories from the field:

Feature: MPA success in California—for biodiversity, threats, and value.

Awards: Meet the SlingShot awardee using eOceans to protect migrating whales.
Check-in: Follow this eco-tourism science team using eOceans to track sharks and wildlife.


“This is what we’ve been dreaming of.”
Fishery biologist
“eOceans offers invaluable tools for seamless data collection-to-analysis, enabling unprecedented collaboration and insights.”
Liz Ferguson, CEO, Ocean Science Analytics
“eOceans empowers us to optimize our data collection by engaging dive centres, resorts, and local communities. By maximizing our field time, we can focus on gathering insights while eOceans seamlessly manages the data processing and analysis.”
Jess Hodge, Marine Biologist, Maldives Underwater Initiative at Six Senses

See it in action.
Watch this short video for a quick look at the eOceans app in action.
“It all starts with your question. Whether you're tracking a species, fishery, wildlife, restoring ecosystems, tackling pollution, or shaping smarter policies, eOceans gets you there faster, easier, smarter.
Dr. Christine Ward-Paige, CEO eOceans

Join others deploying fast, seamless, transparent science and dissemination.
Use the mobile app or dashboard to create and join projects, upload data, analyze results, contribute to science, and more.
Features | Explainer | Book Demo | Spec sheet